Workflow Execution Details
Workflow Execution Details provides a comprehensive view of a Workflow execution to include the steps, logs, artifacts, and configuration – helping you understand outcomes and troubleshoot any potential issues.
To view Workflow Execution Details, you must choose a Workflow execution then select Open Details & Logs. Selecting a single step/runtime instance or the entire execution facilitates your ability to view progress and pinpoint any failures within the overall Workflow.
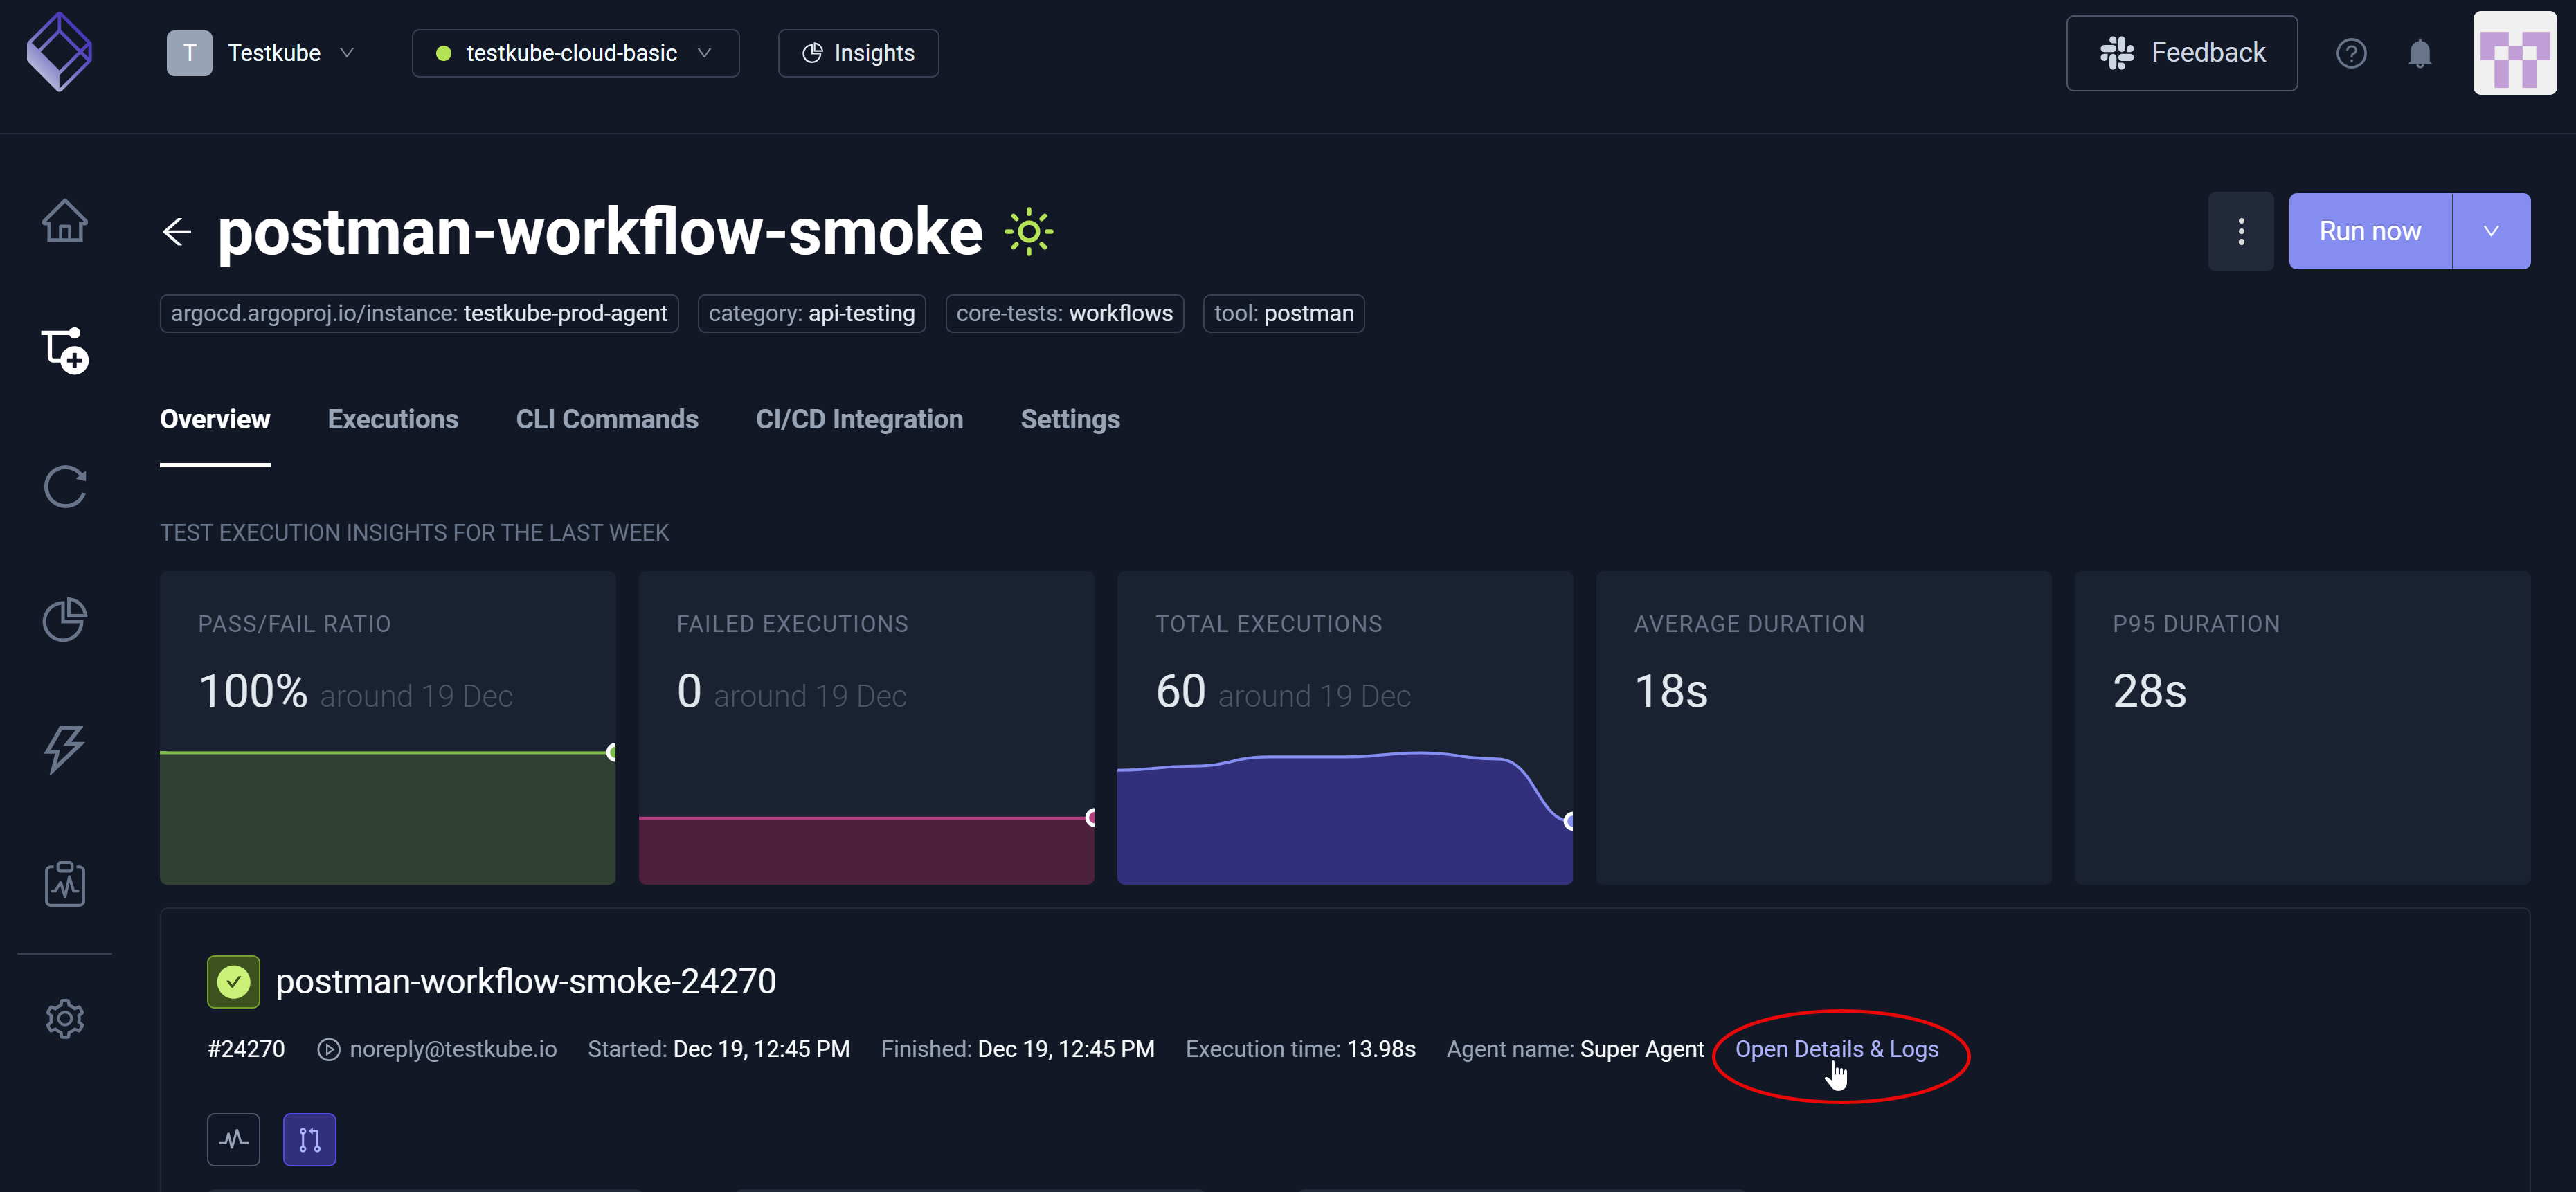
After you select Open Details & Logs, you have access to the Log Output, Artifacts, Resource Usage, Flowchart, CLI Commands, Events, and Workflow Definition tabs that – upon selection – provide additional insight specific to the Workflow execution you selected. There will also be a JUnit Reports tab when Testkube detects corresponding JUnit reports. For additional information, read Reports.
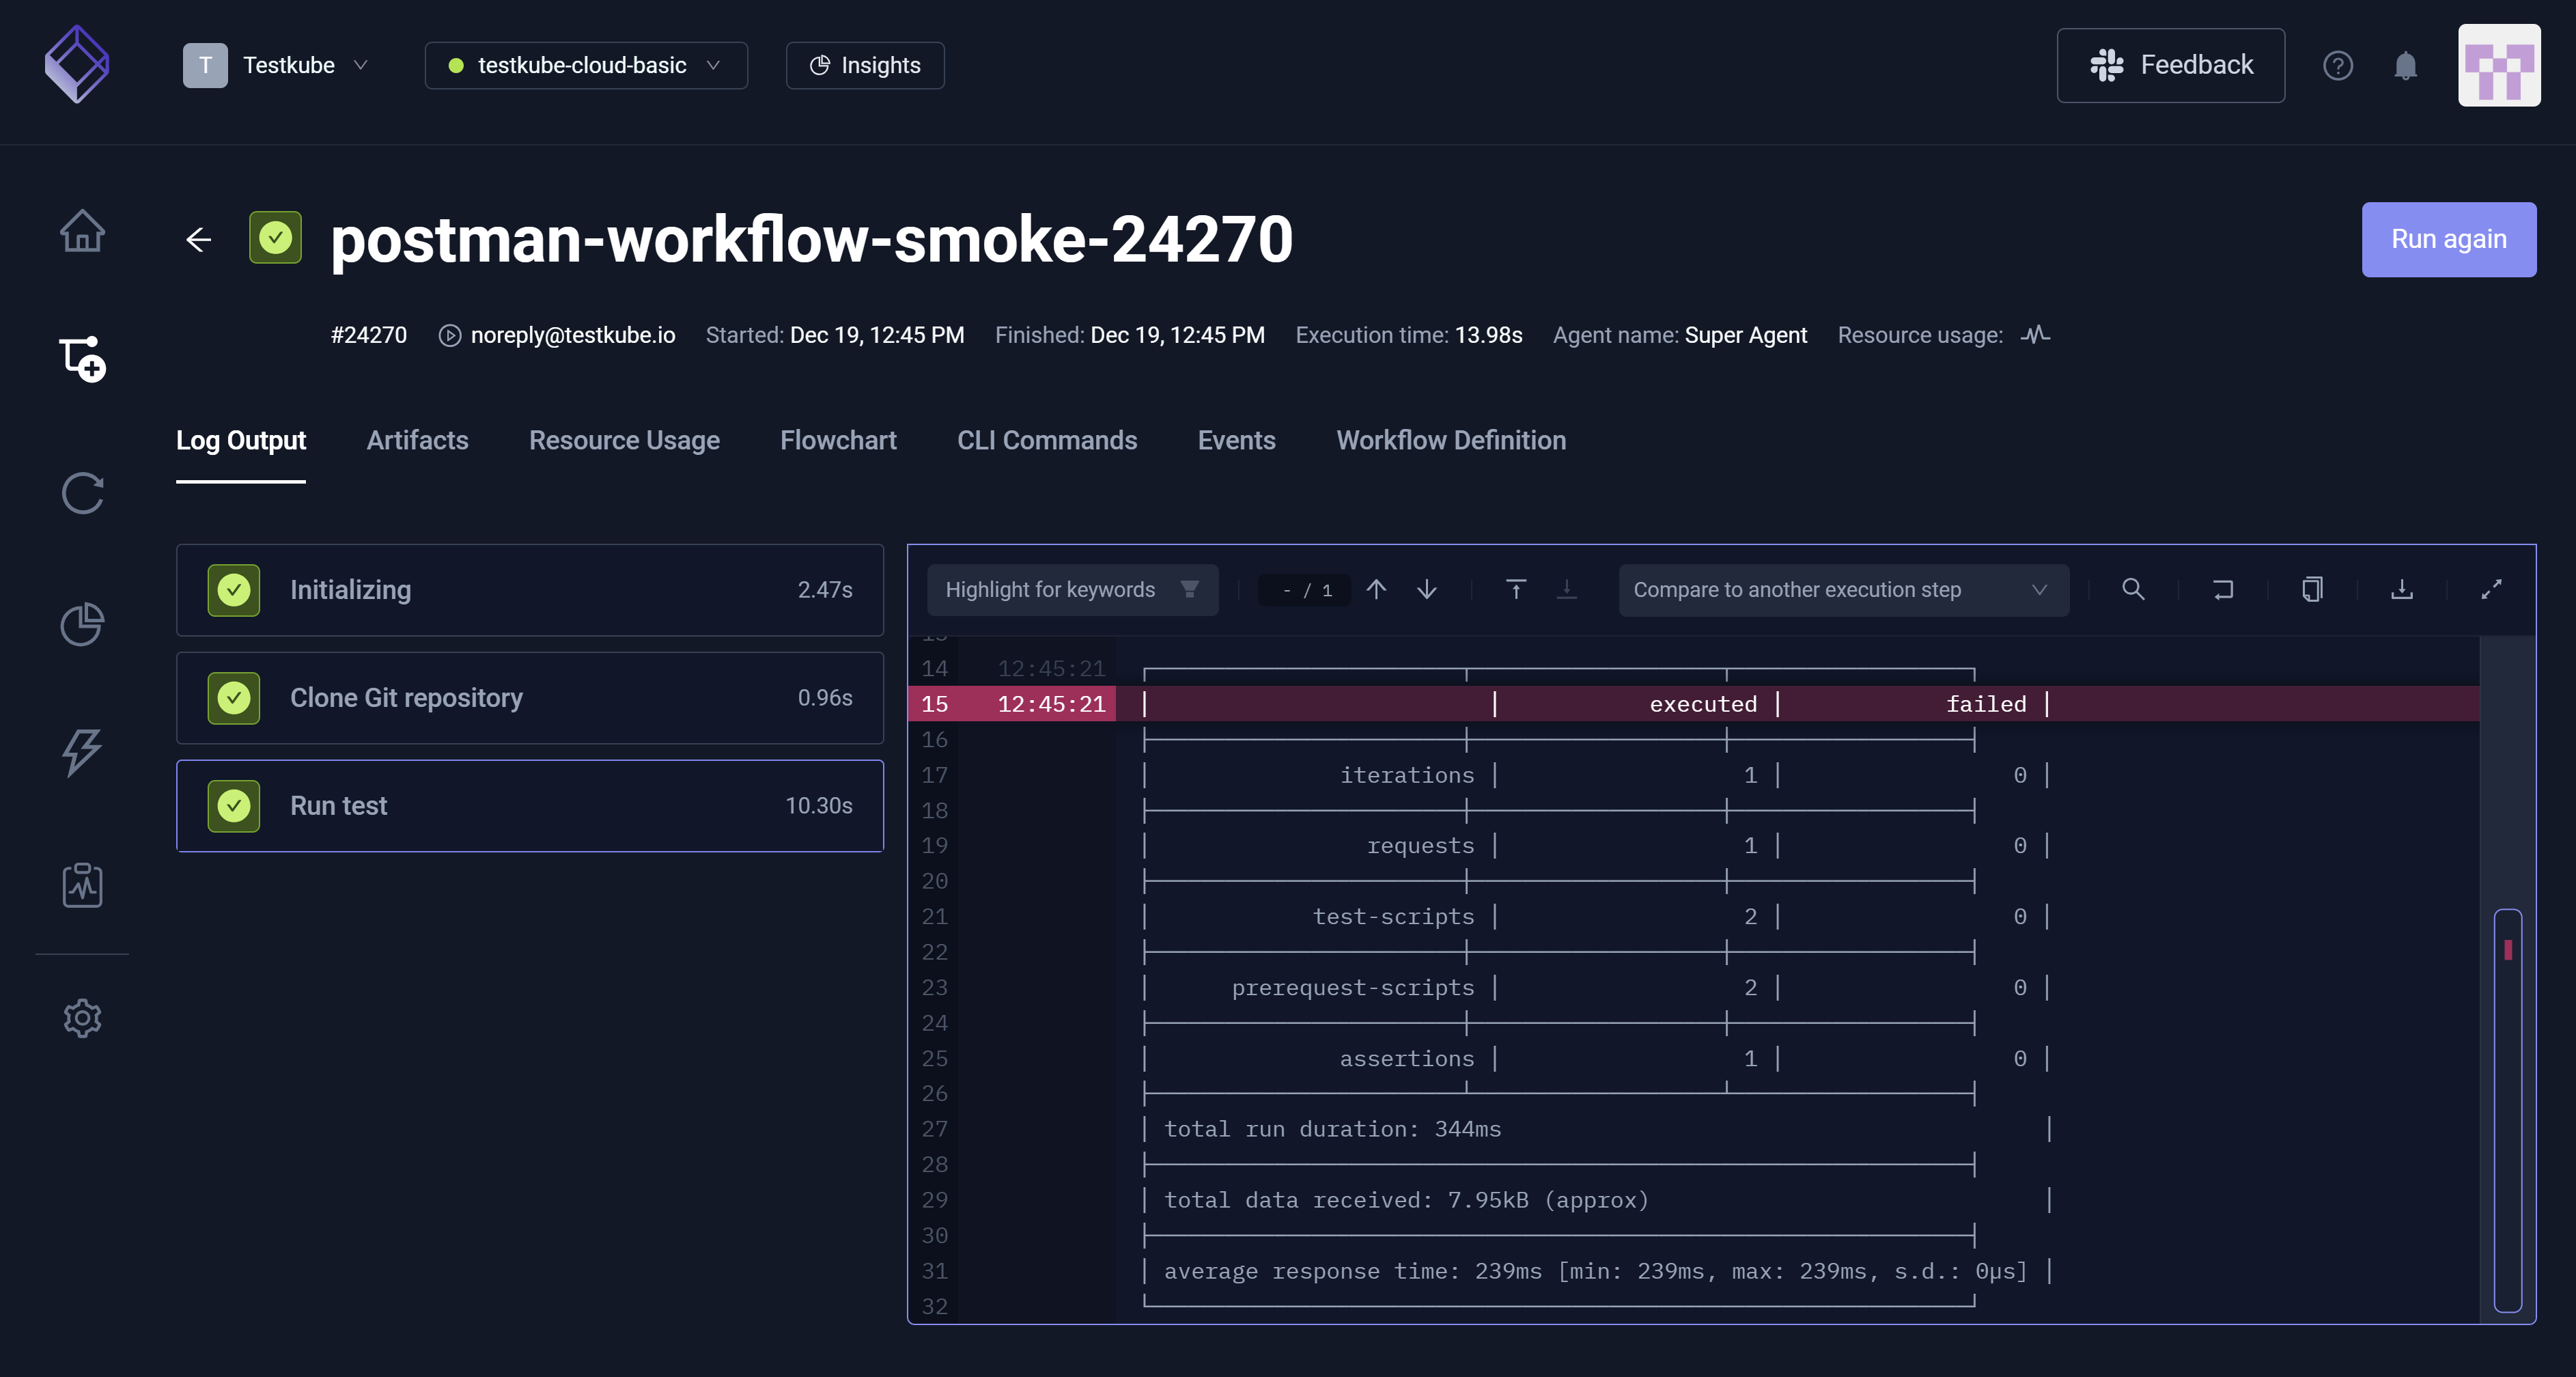
Log Output
This tab displays the Log Output for this execution, providing runtime messages such as Initializing, Clone Git Repository, and Run Test. For additional information, read Log Collection.
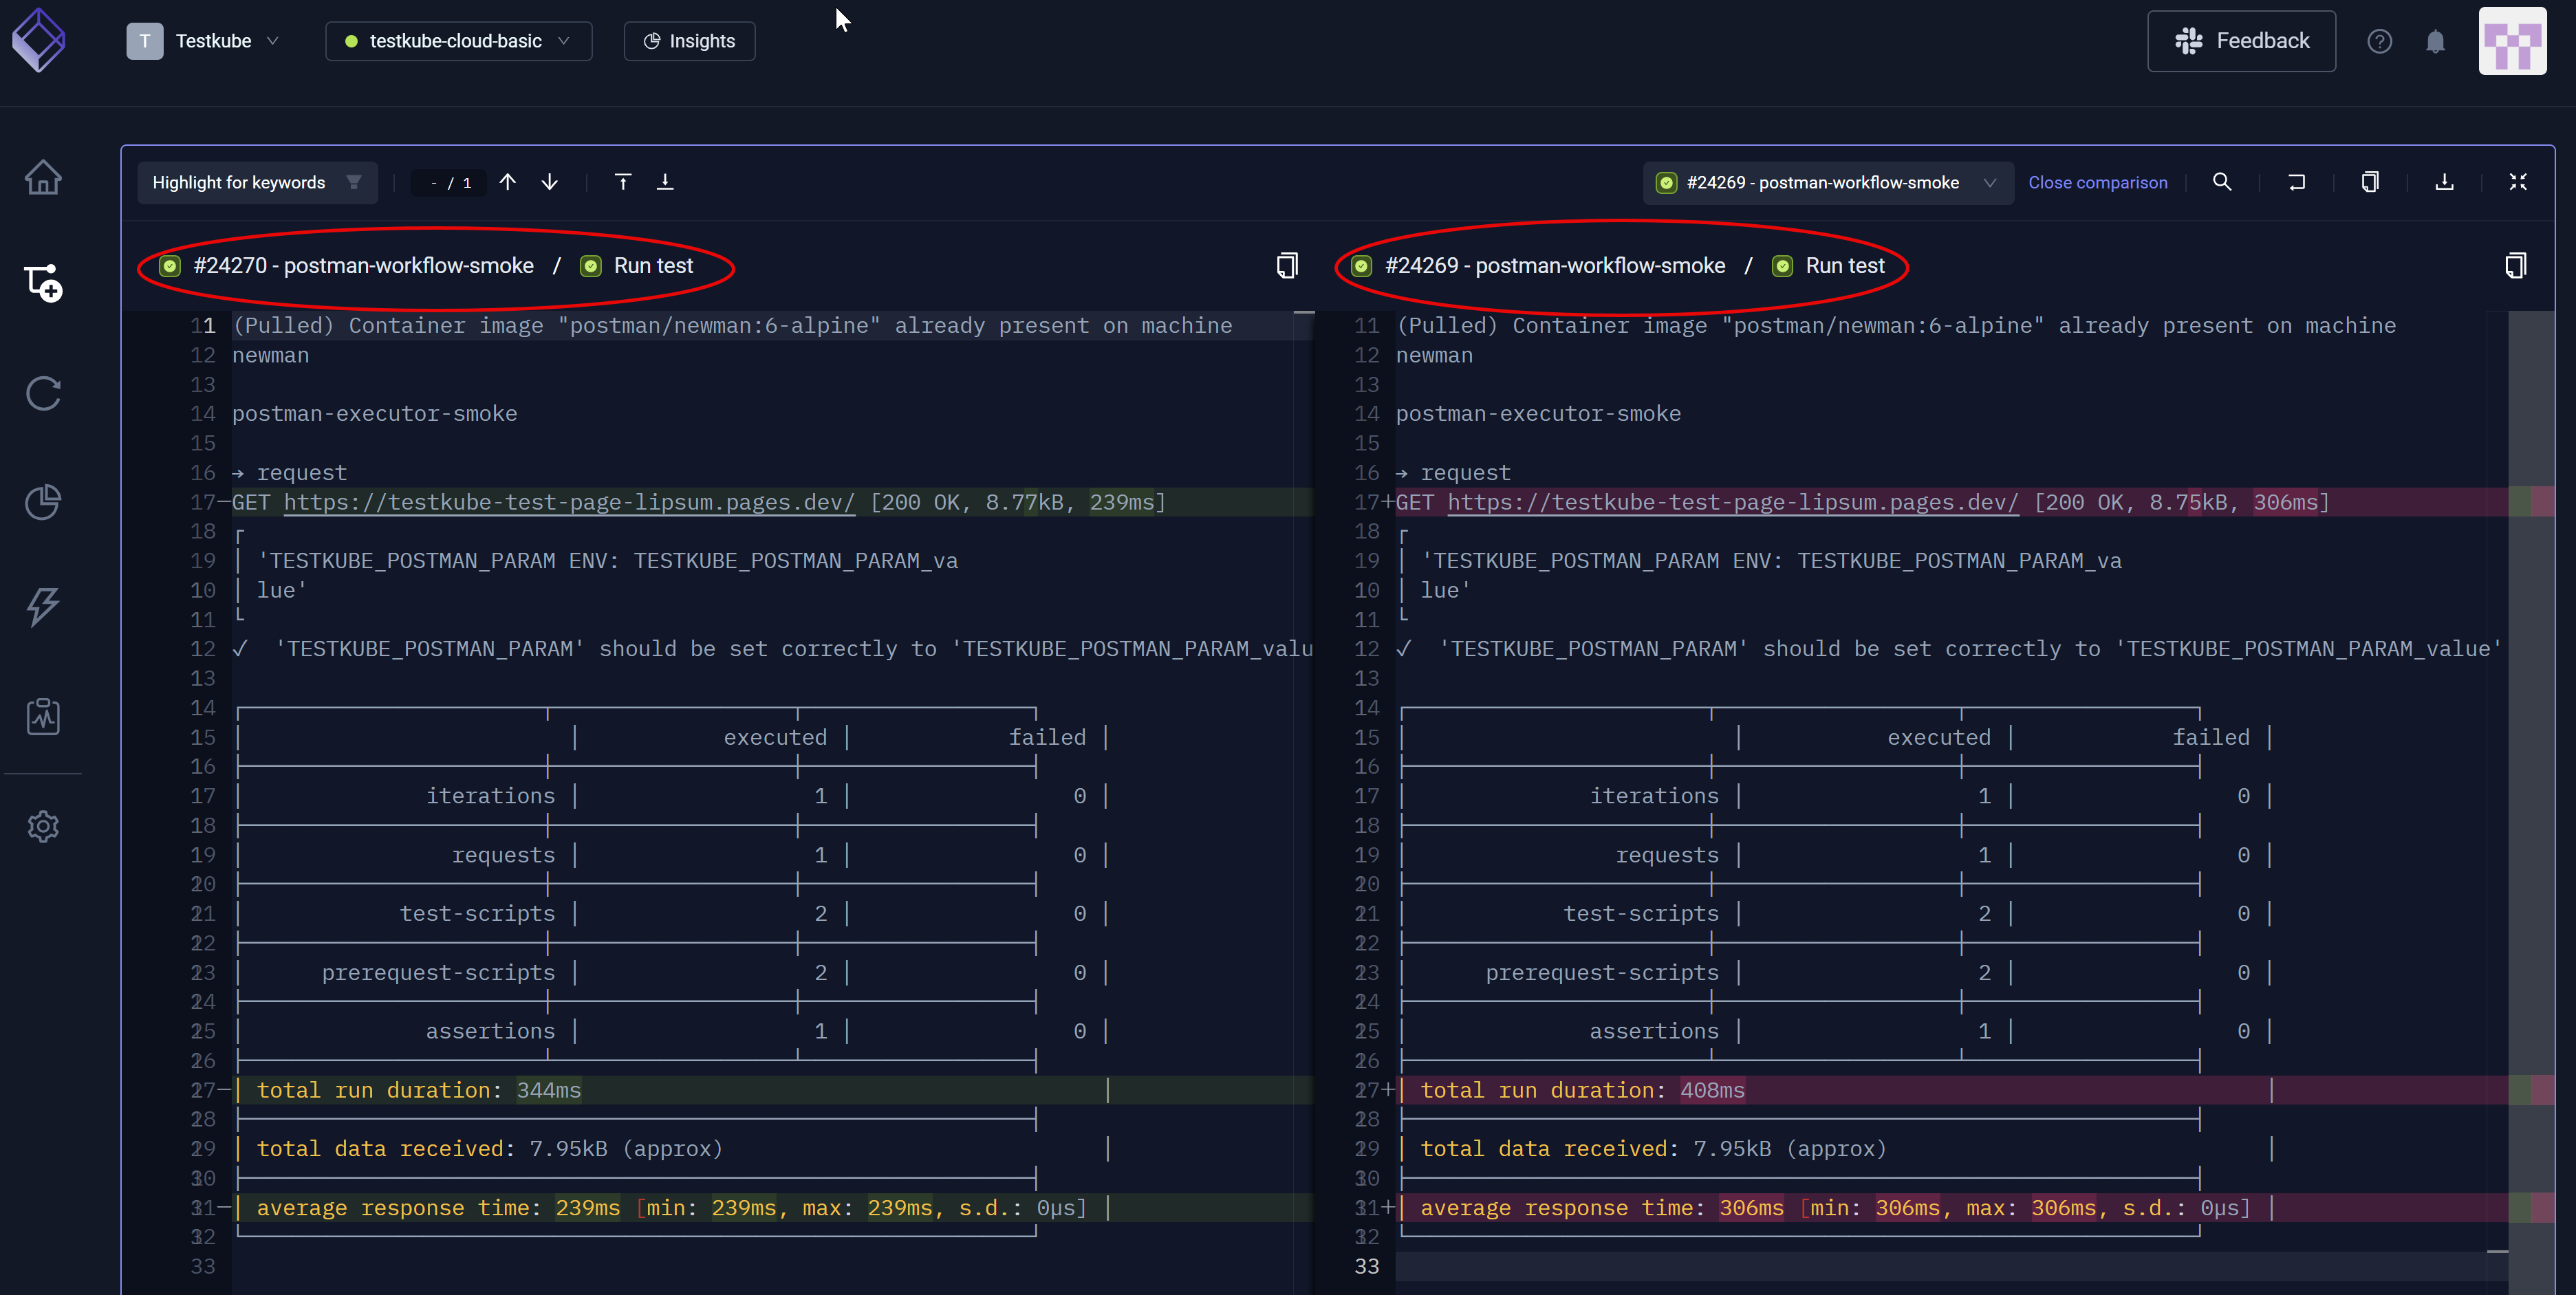
Comparing Logs across Executions
You can select the Compare to another execution step drop-down list box to choose another execution, comparing a second execution step to the first one you selected.
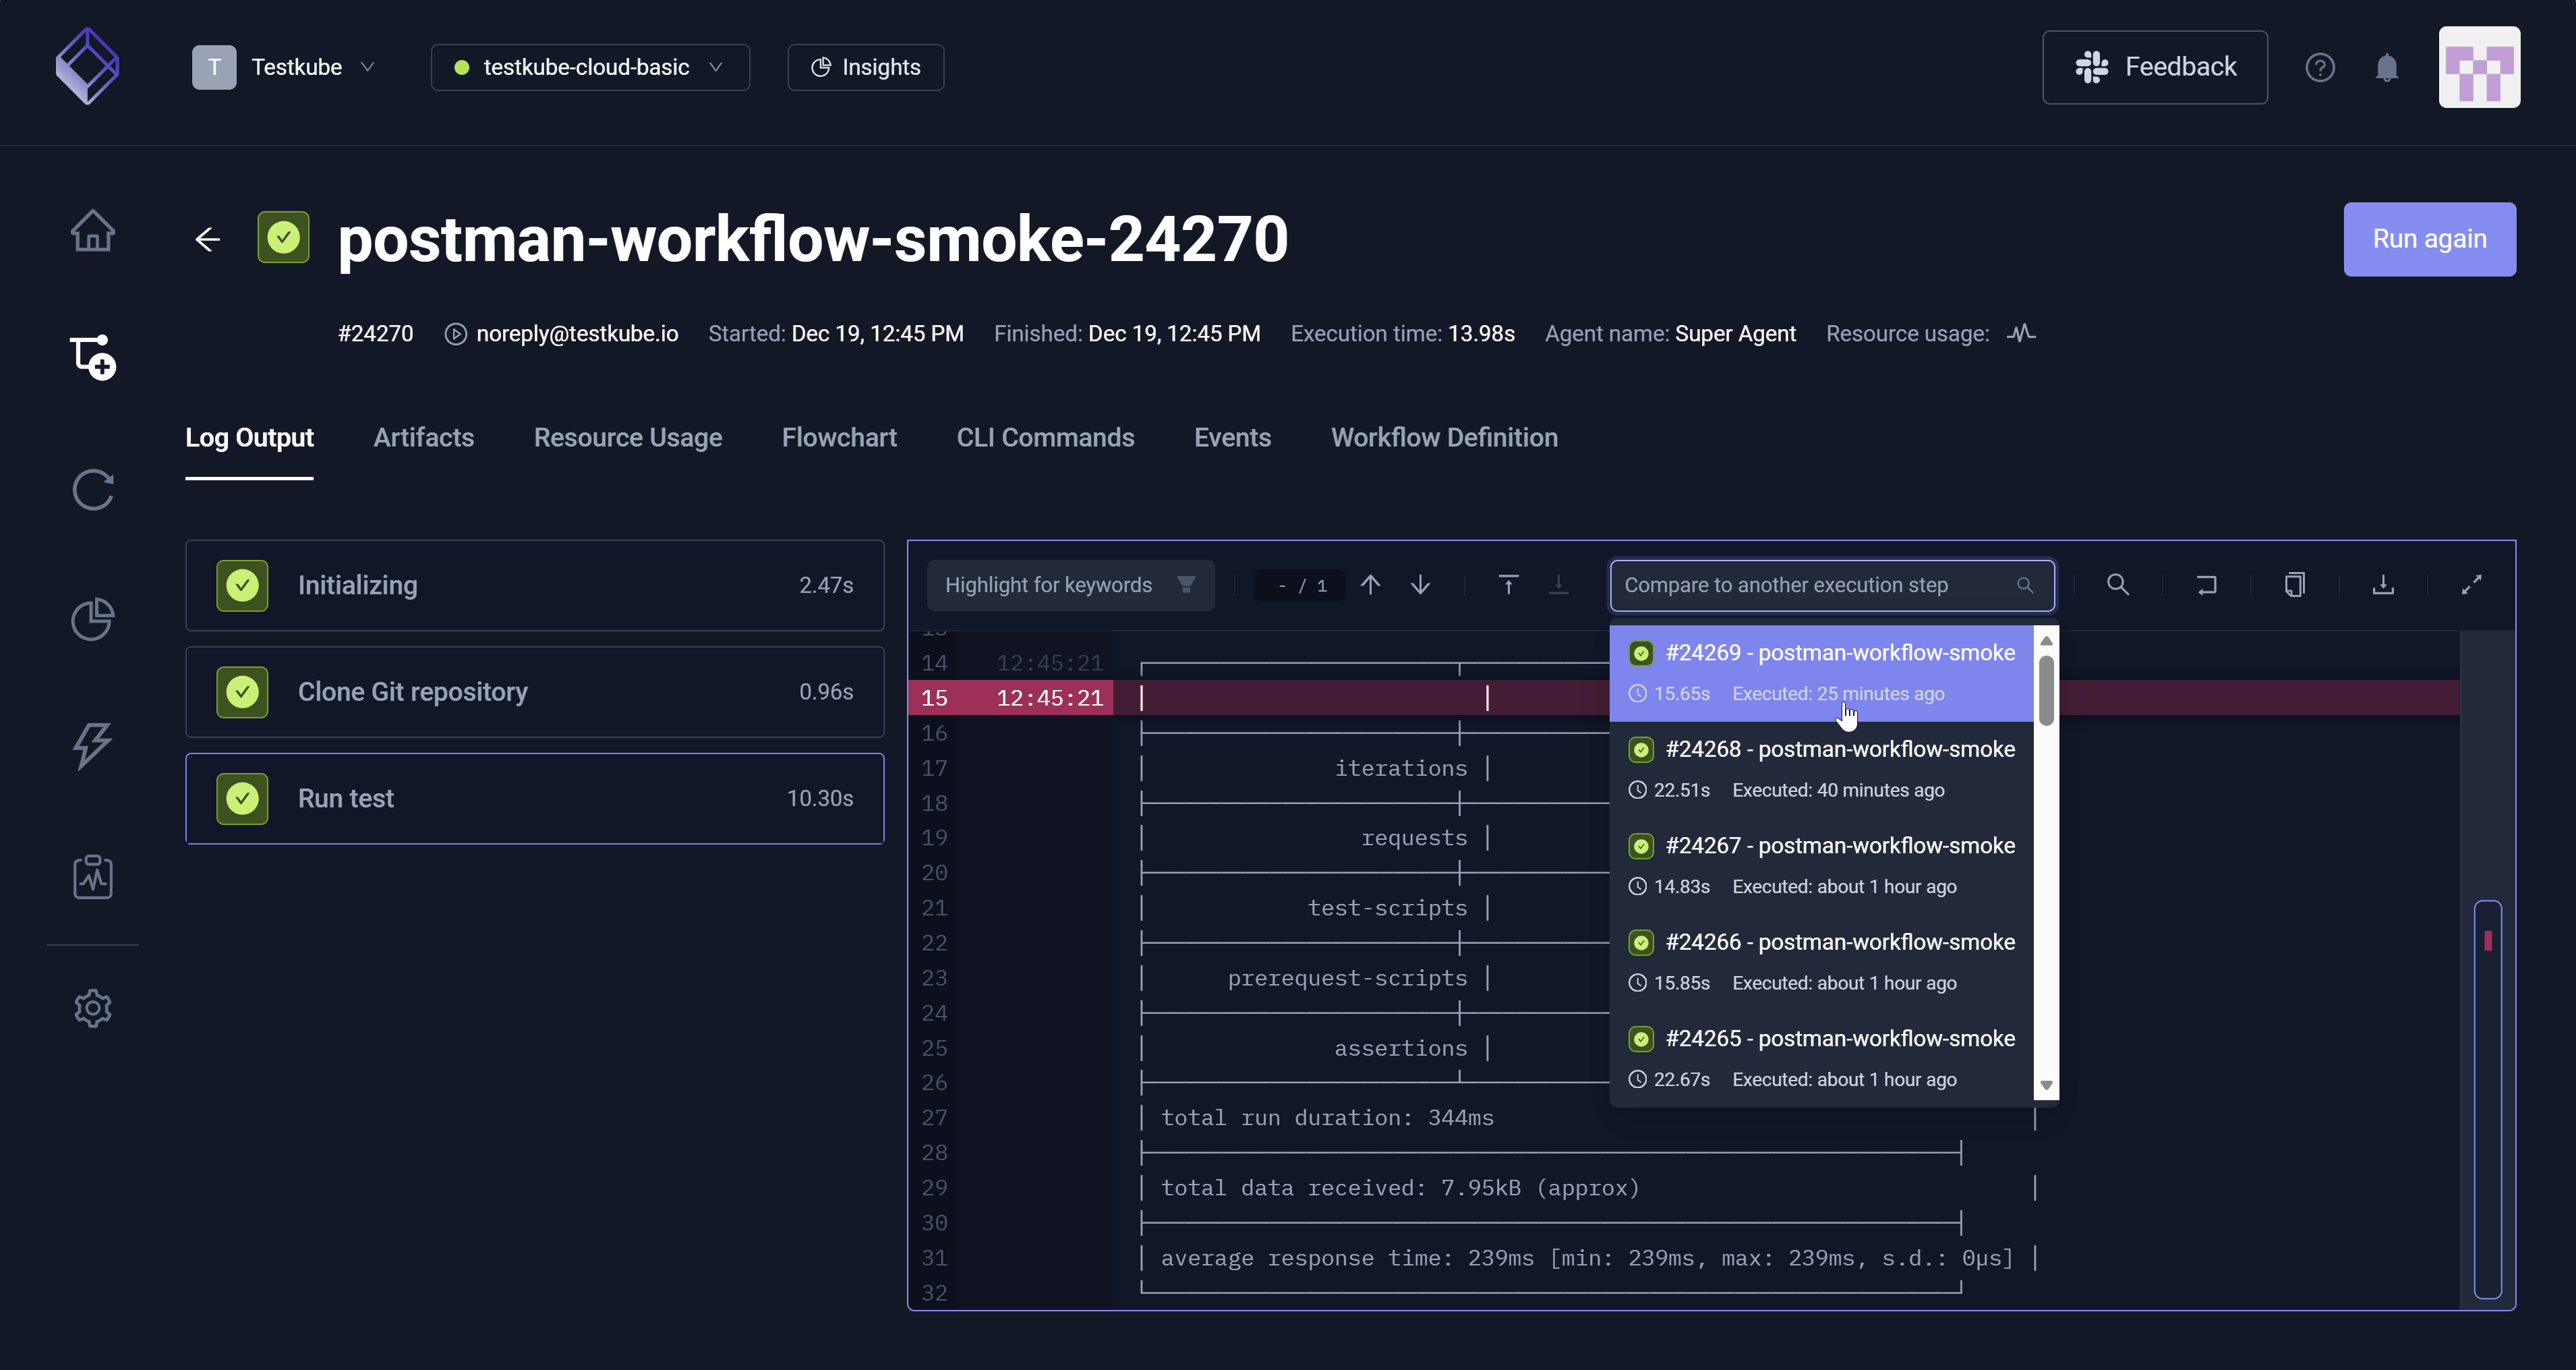
Upon selection of a second comparison execution step, you can view the highlighted differences between the two.
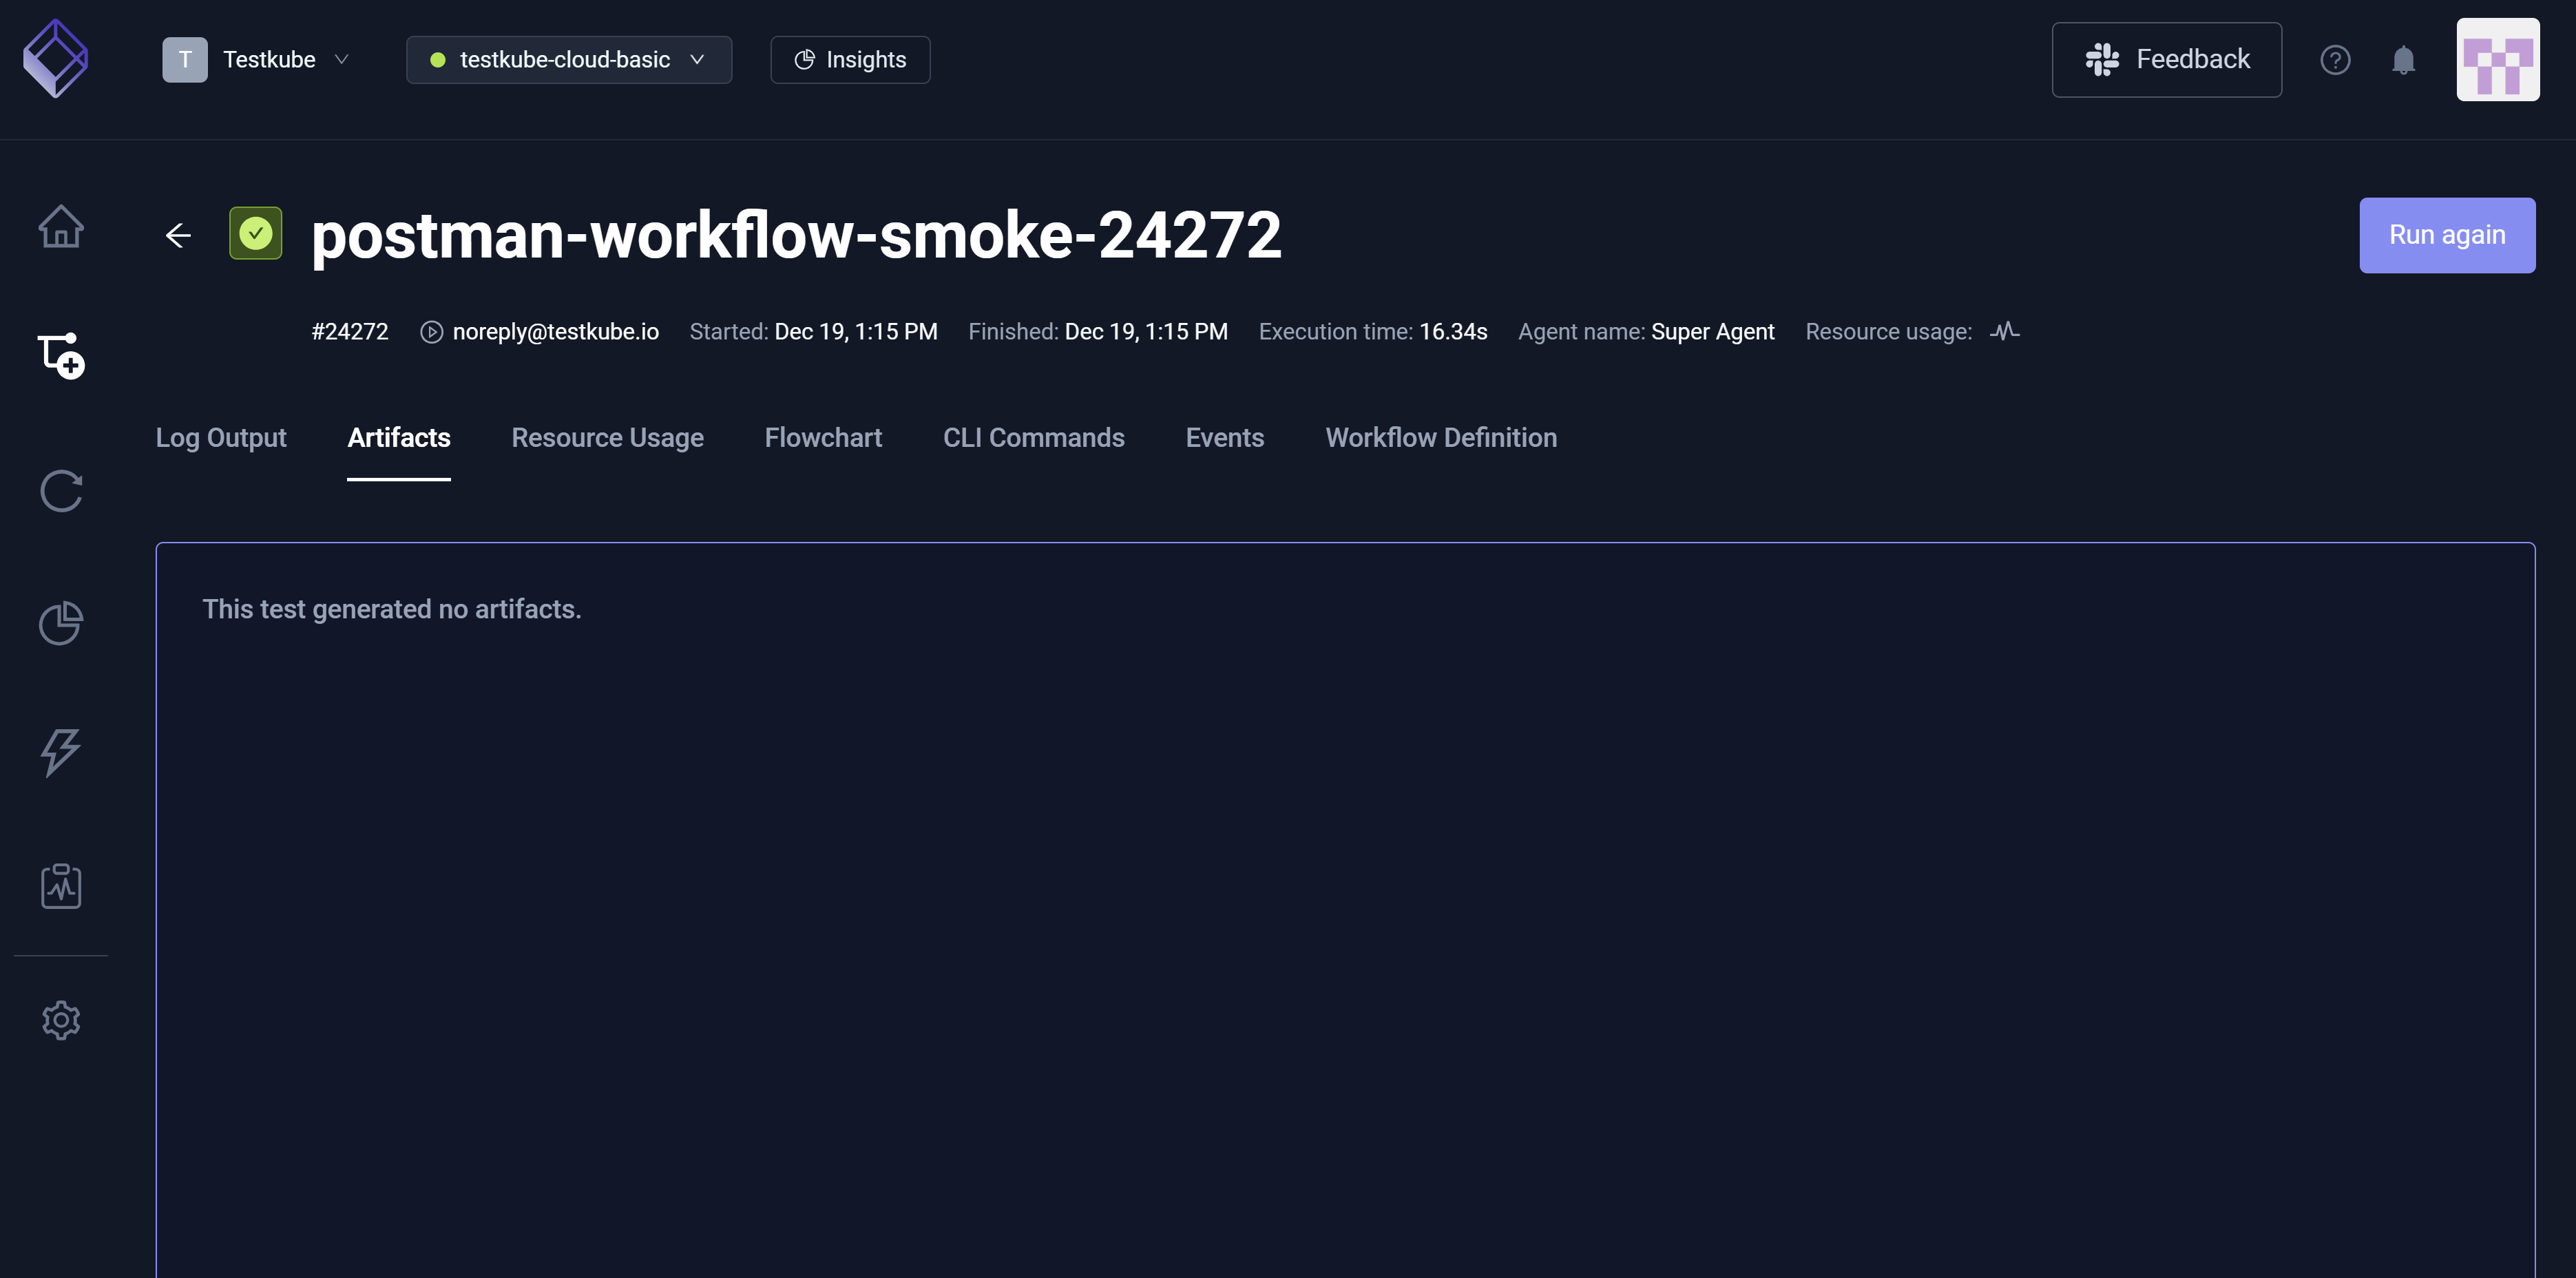
Artifacts
This tab displays artifacts the execution created such as reports, charts, and images. In some cases, there are artifacts; in other cases, artifacts do not exist. For additional information, read Artifacts.
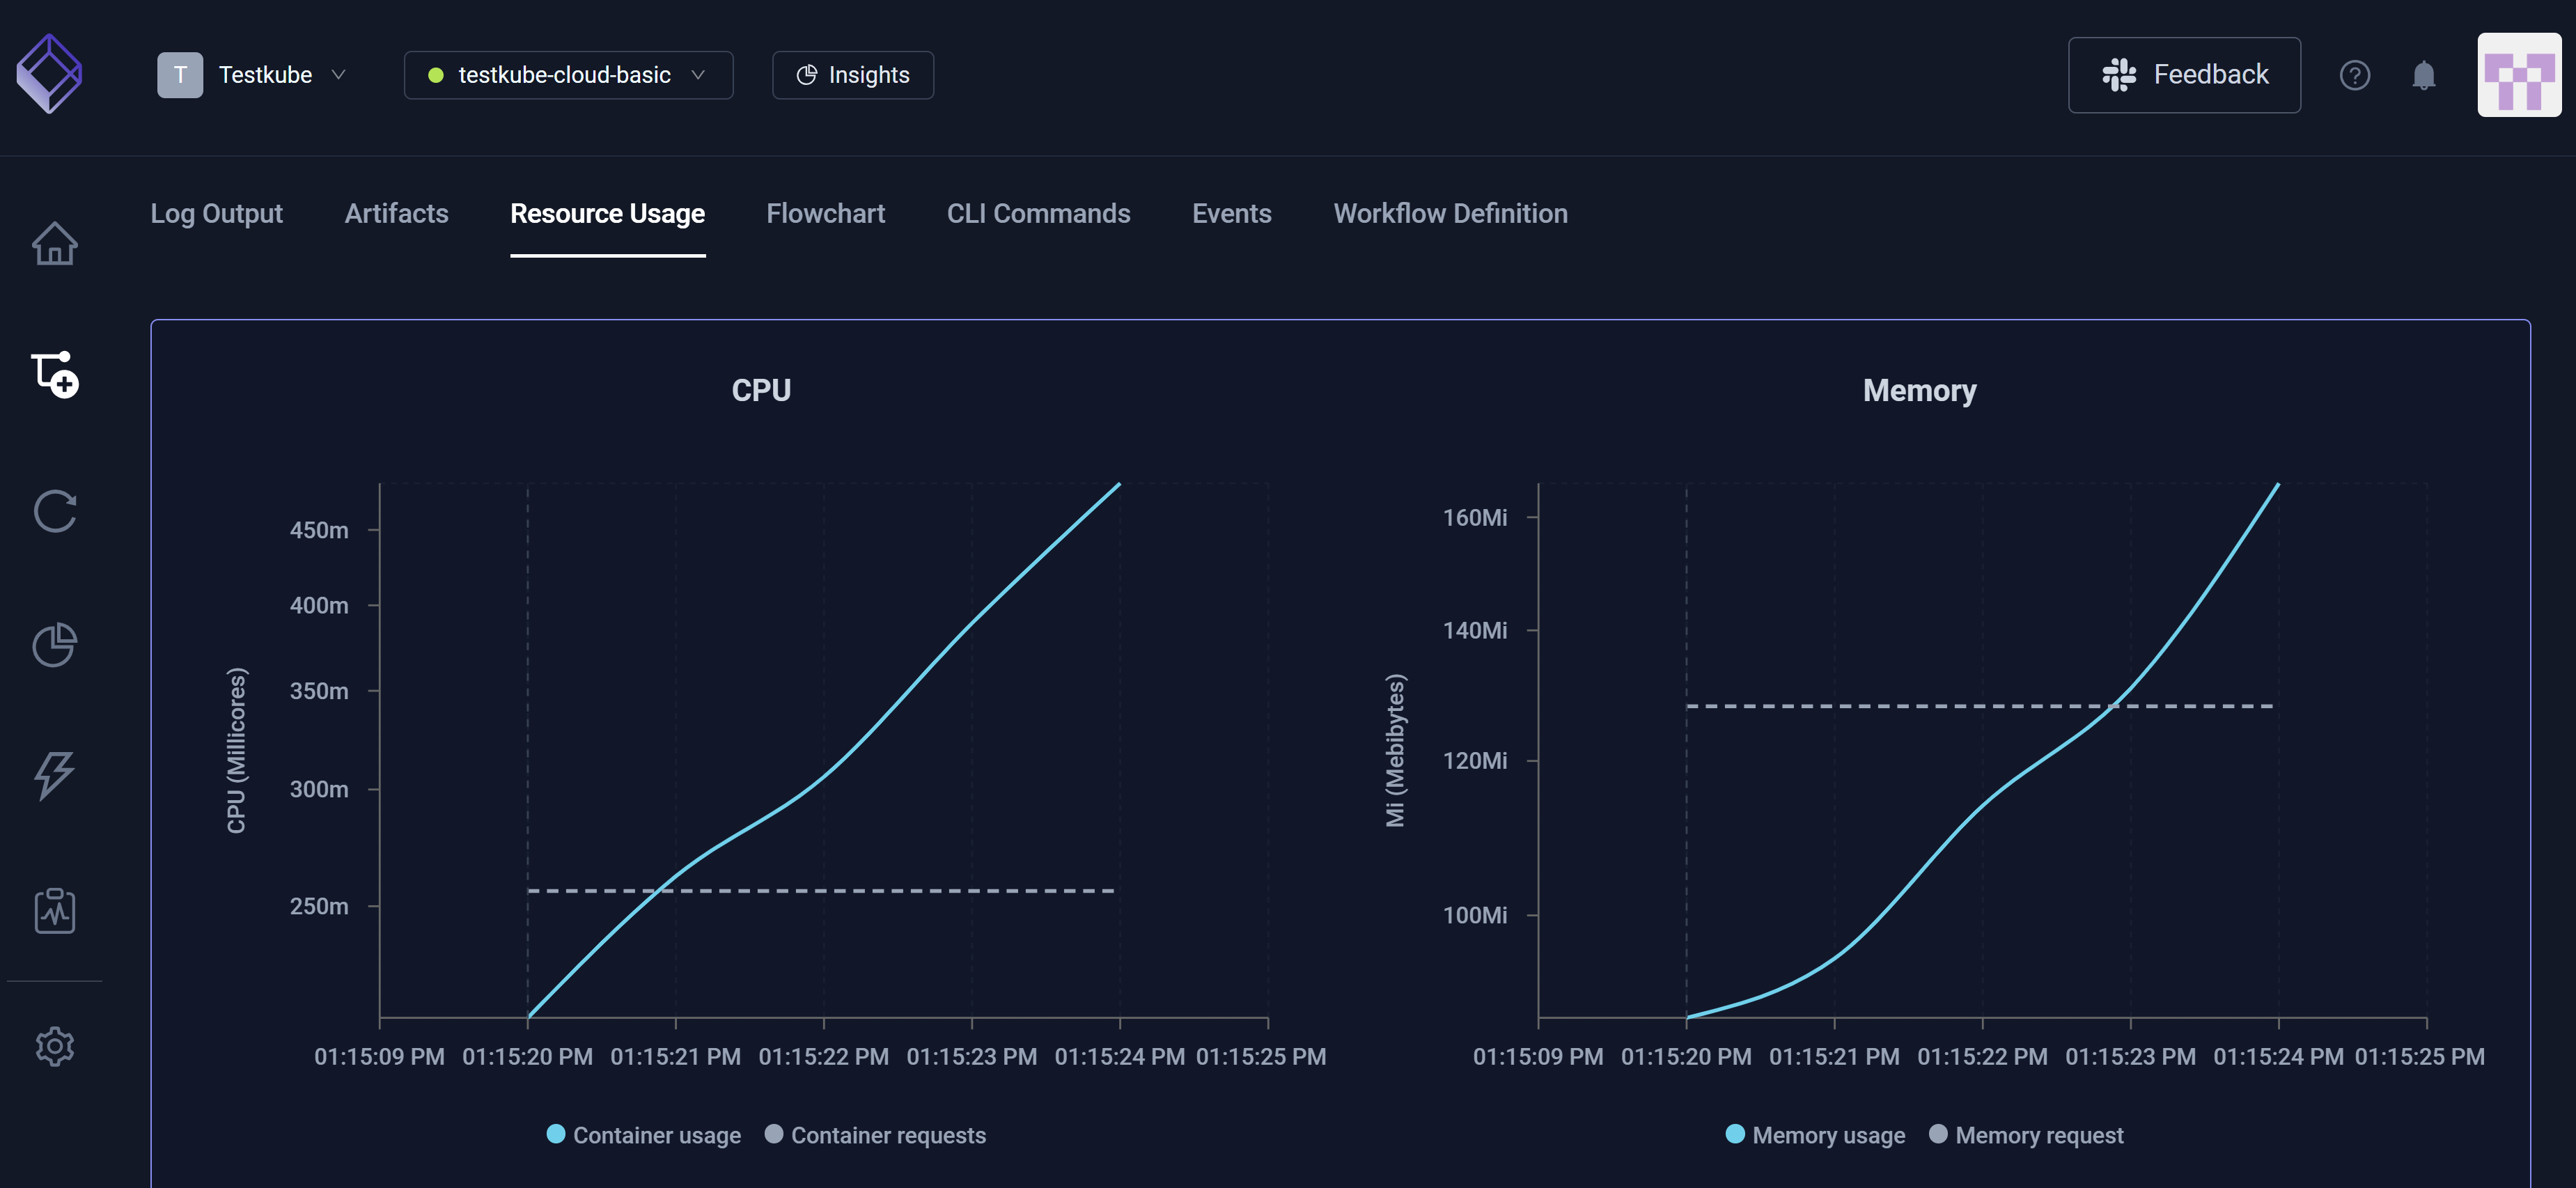
Resource Usage
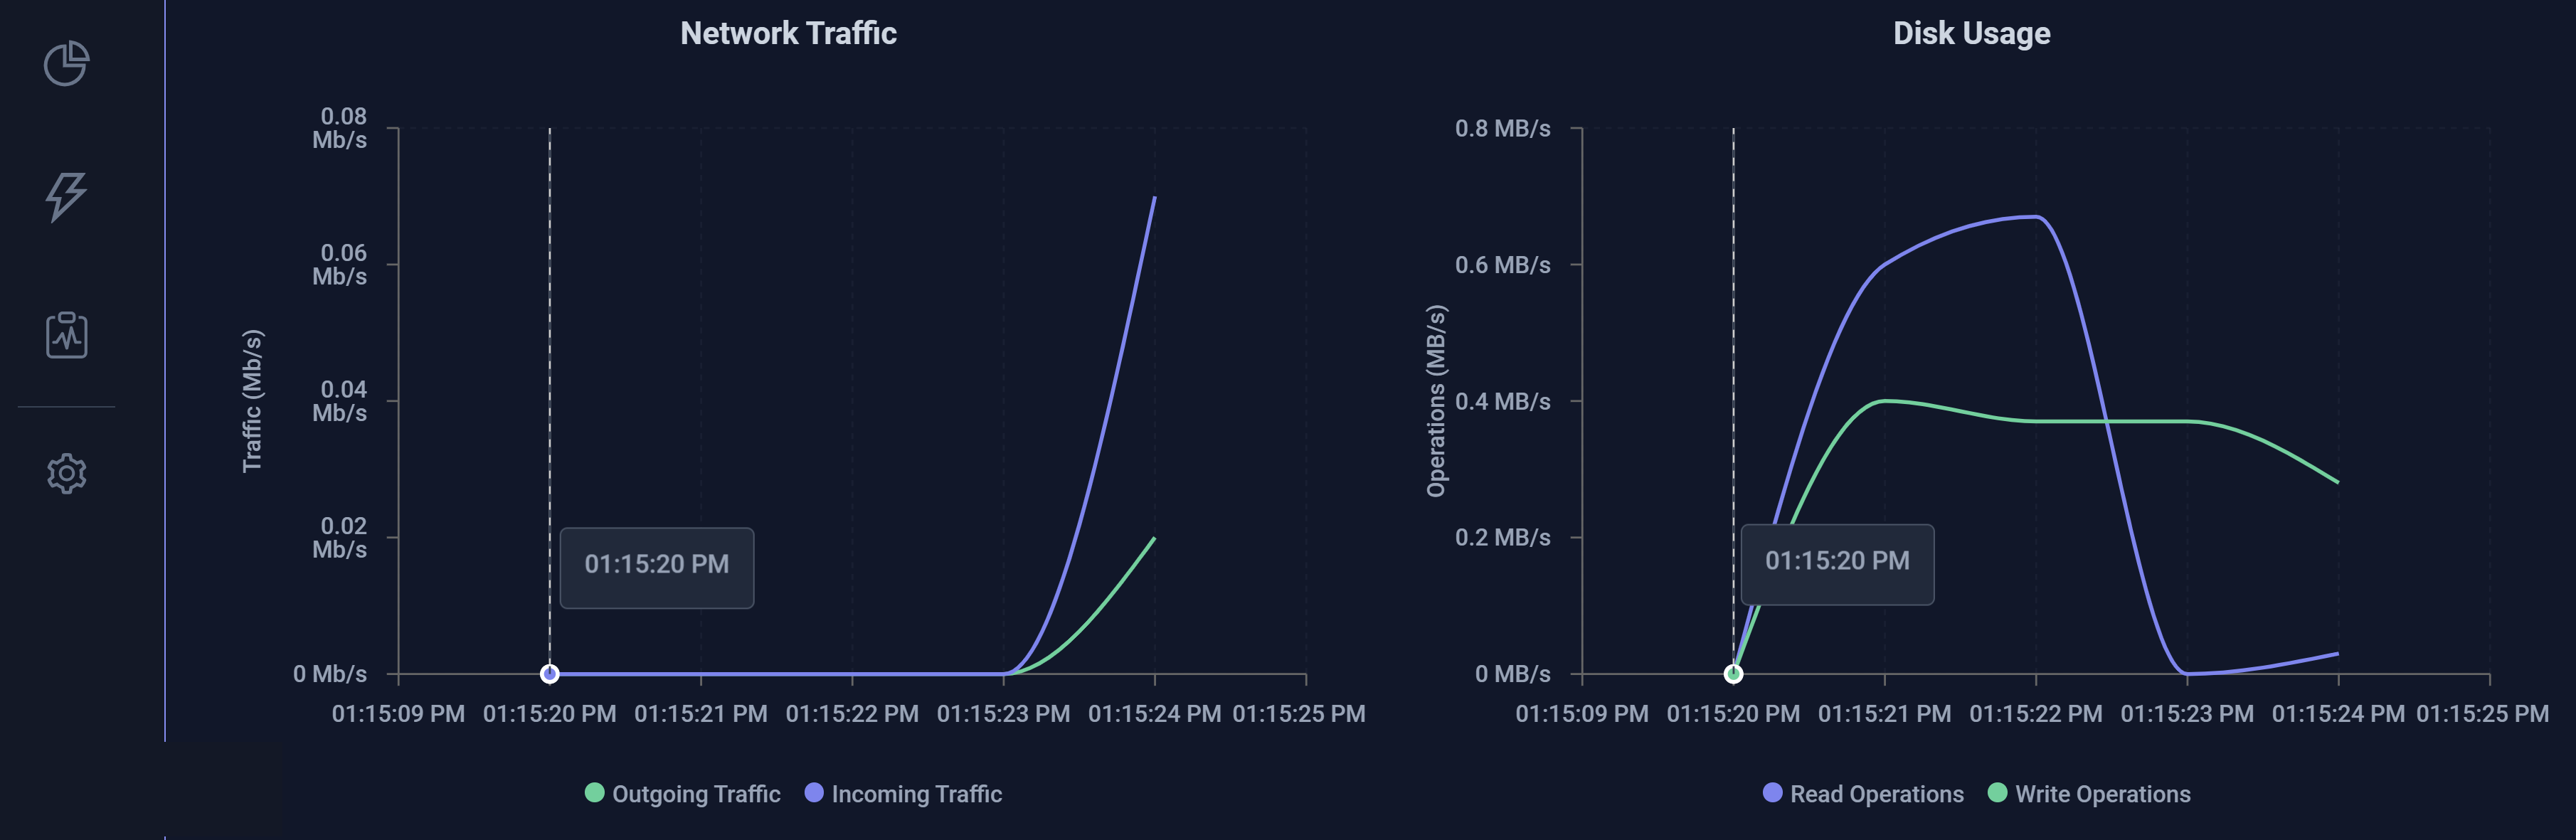
This tab displays CPU and Memory consumption during execution, which helps you both identify performance issues and optimize resource allocation. You can hover over each graph to gain additional insight, such as CPU Container Usage and Container Requests along with Outgoing Traffic and Incoming Traffic relative to Network Traffic.
CPU and Memory
Network Traffic and Disk Usage
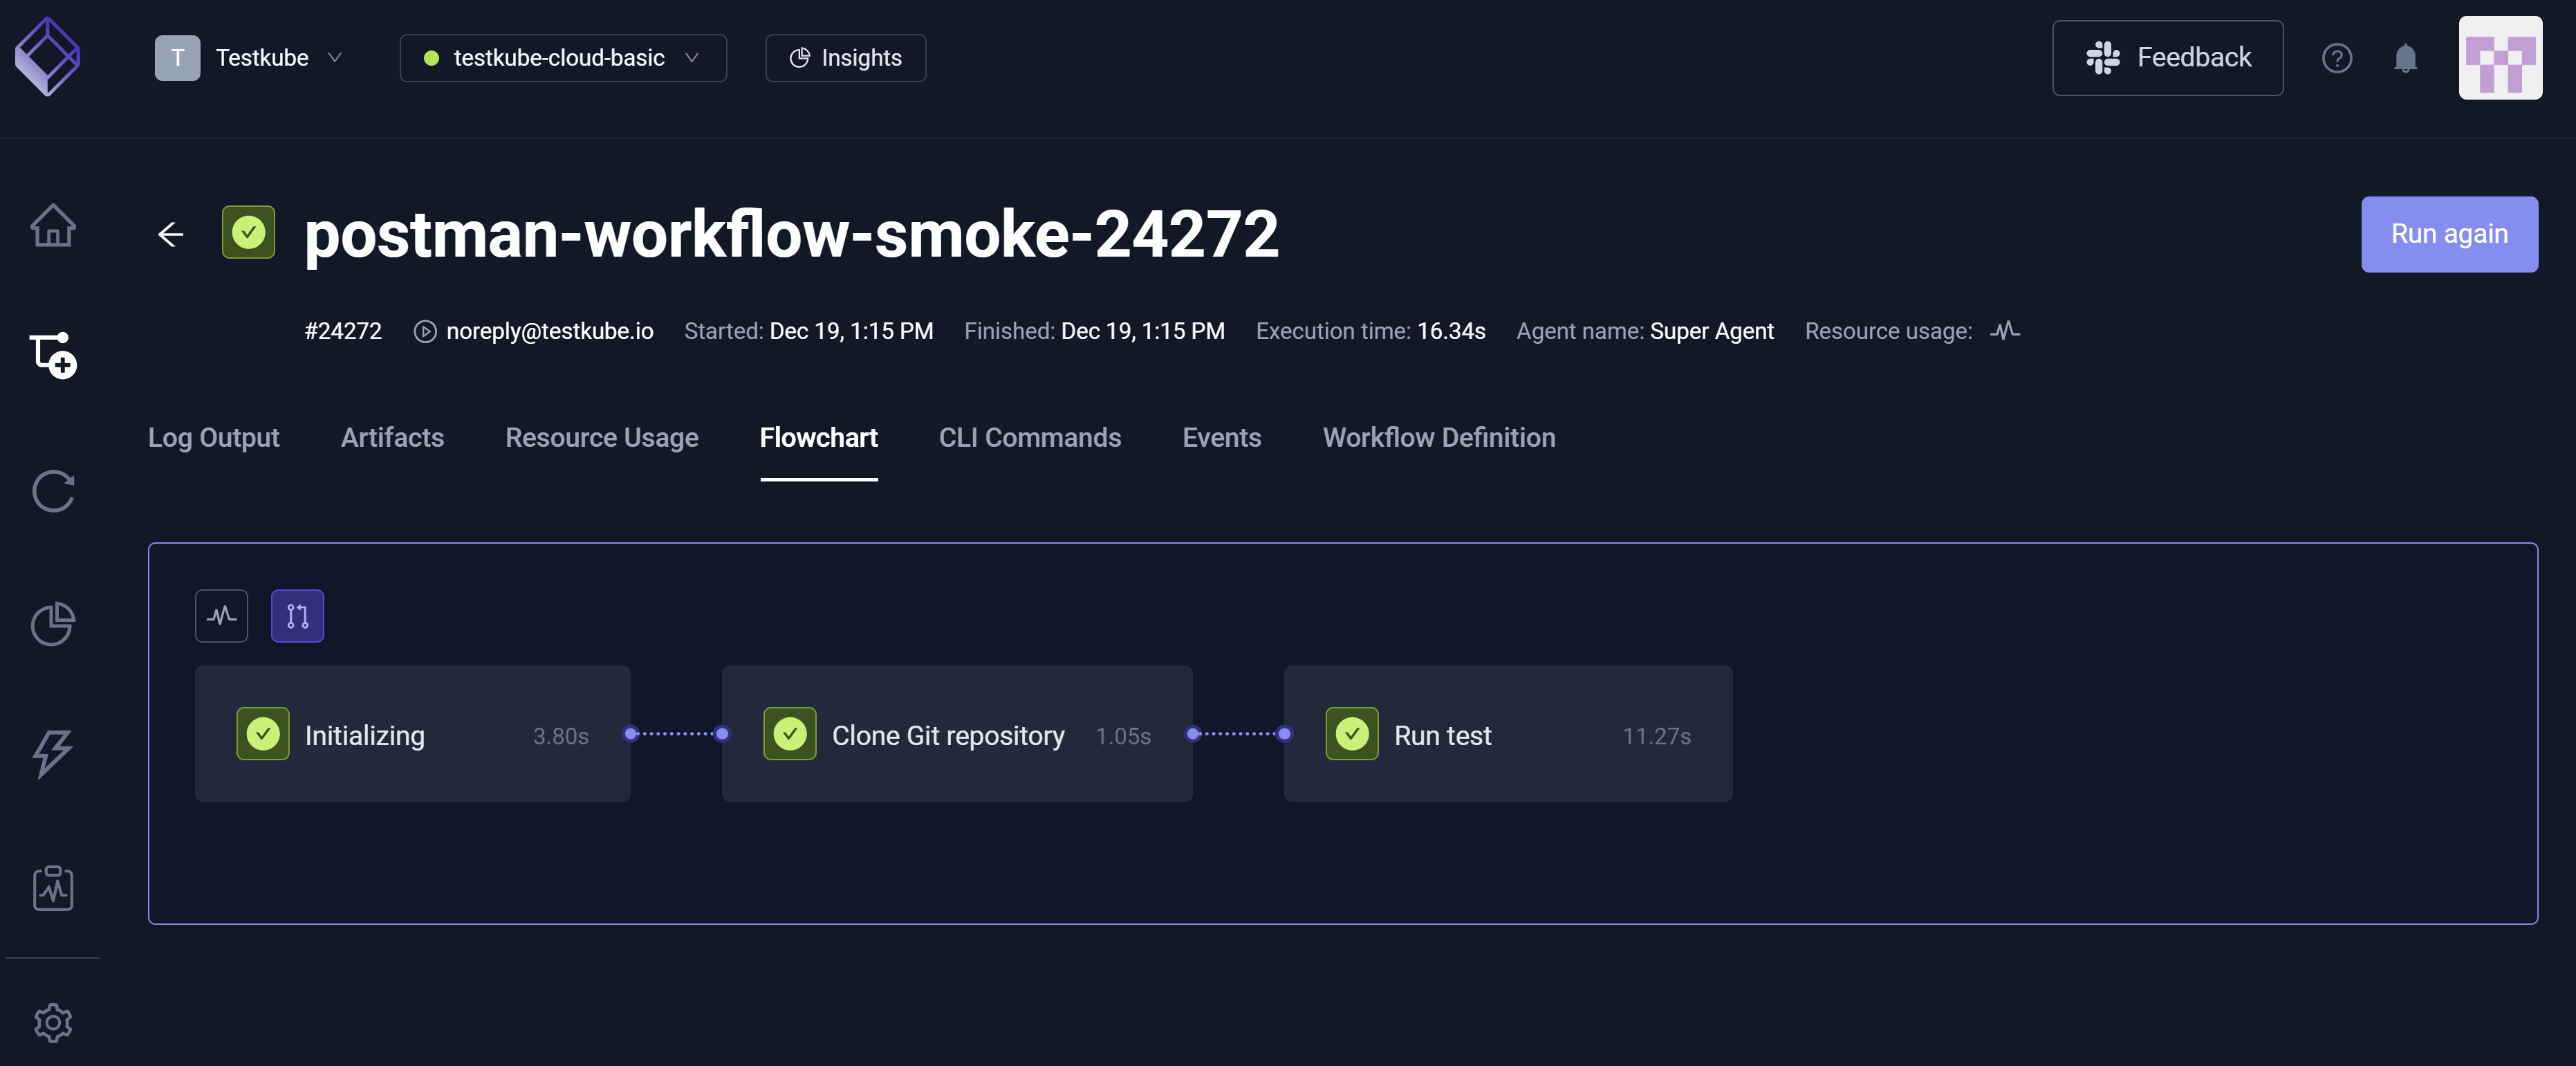
Flowchart
This tab displays a visualization of the Workflow structure and execution path, which helps you understand dependencies, order of operations, and failure points.
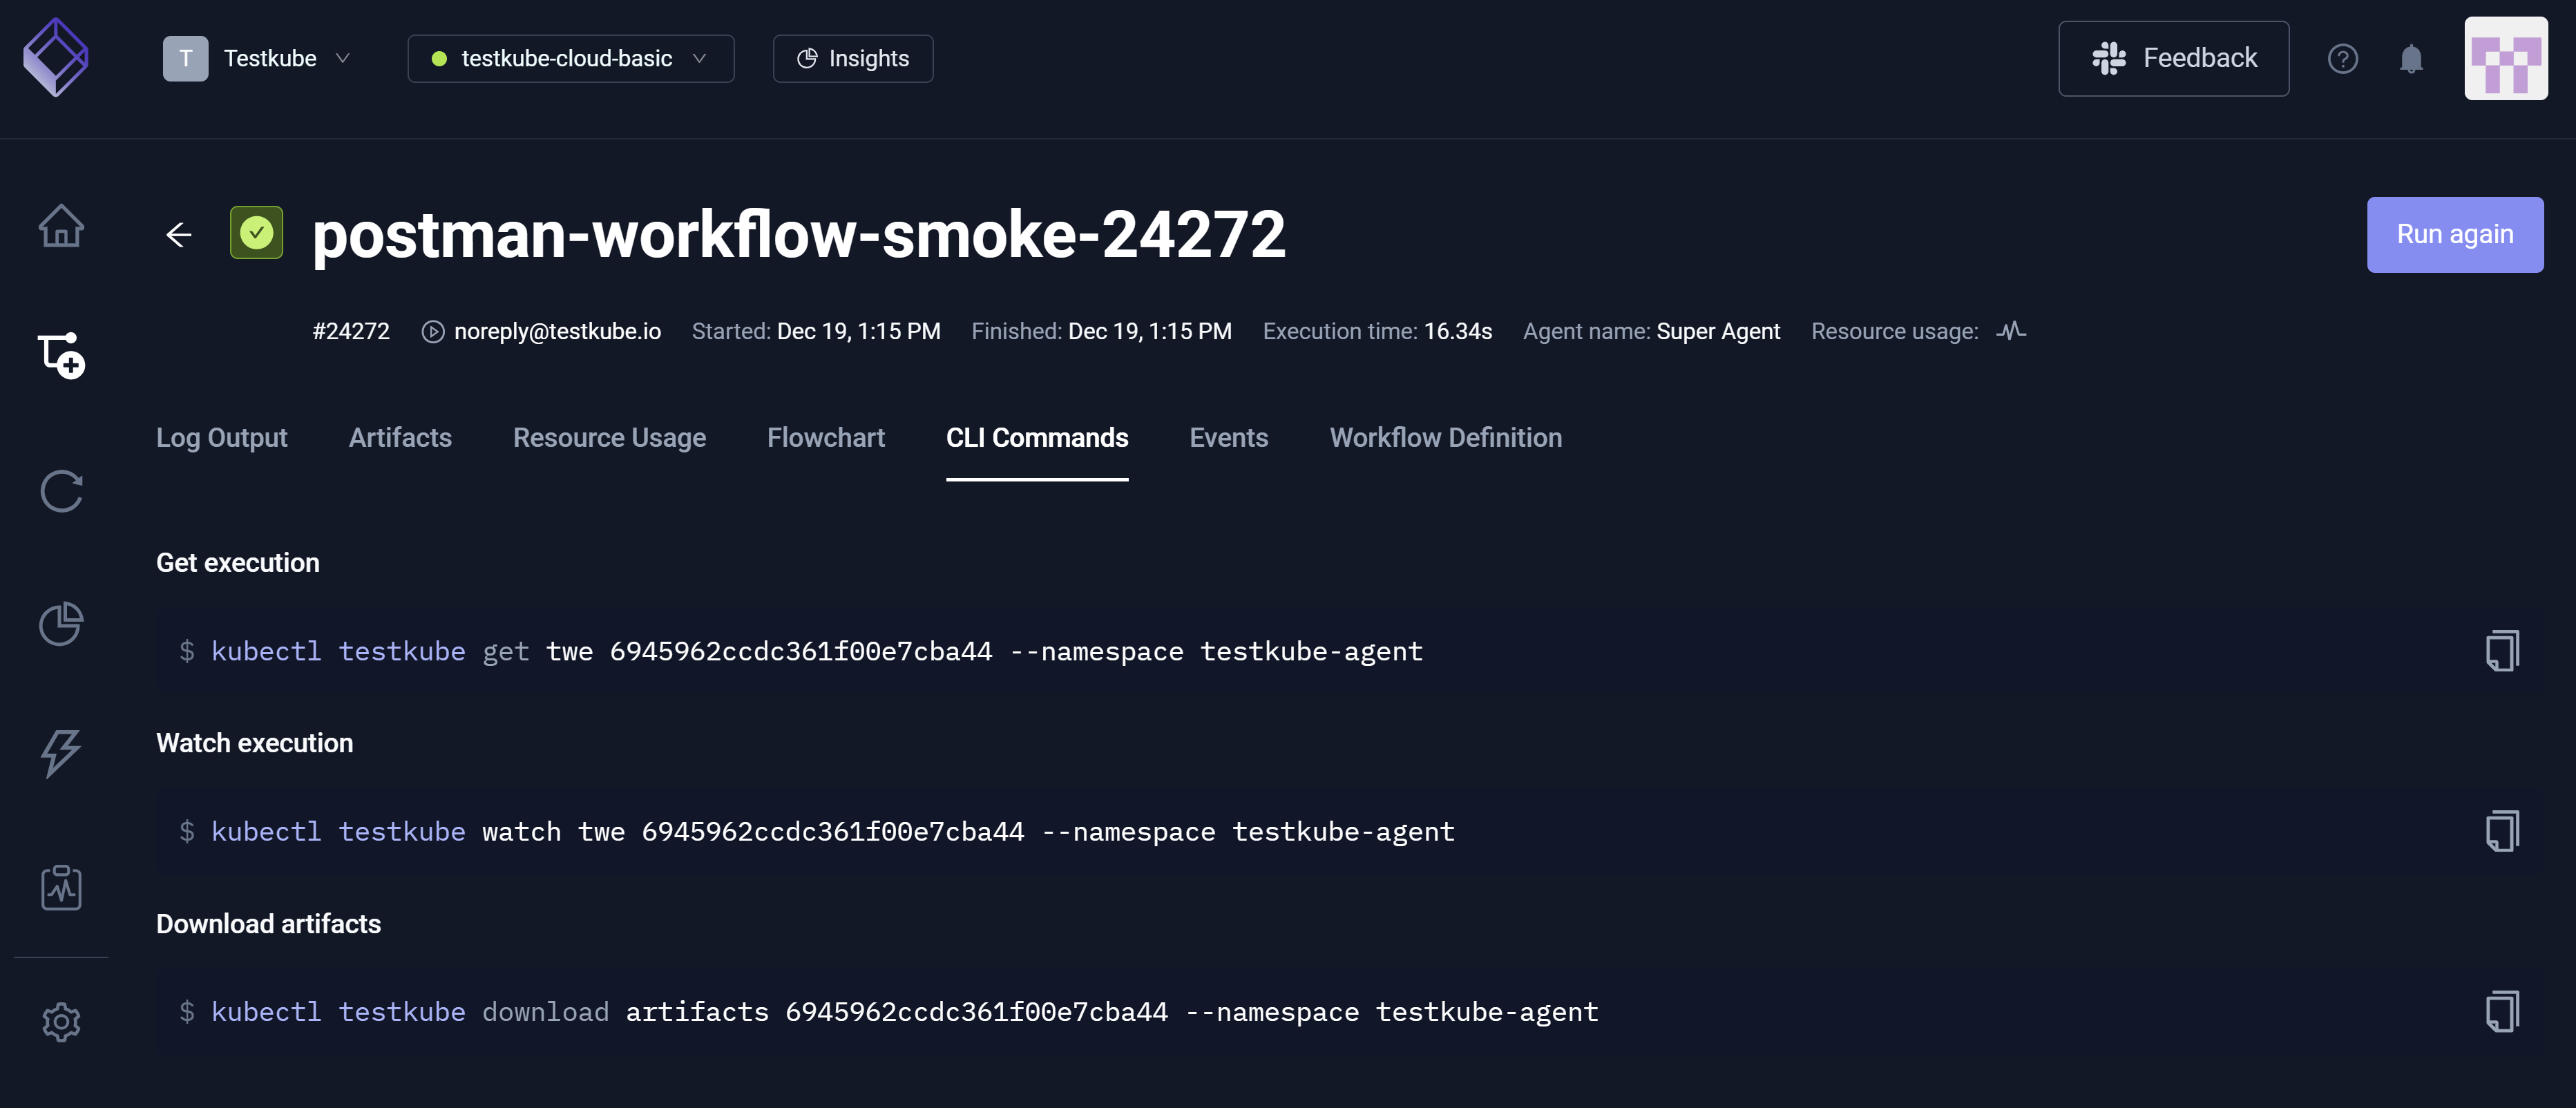
CLI Commands
This tab shows CLI commands that you can use to interact with this Workflow execution with Testkube CLI.
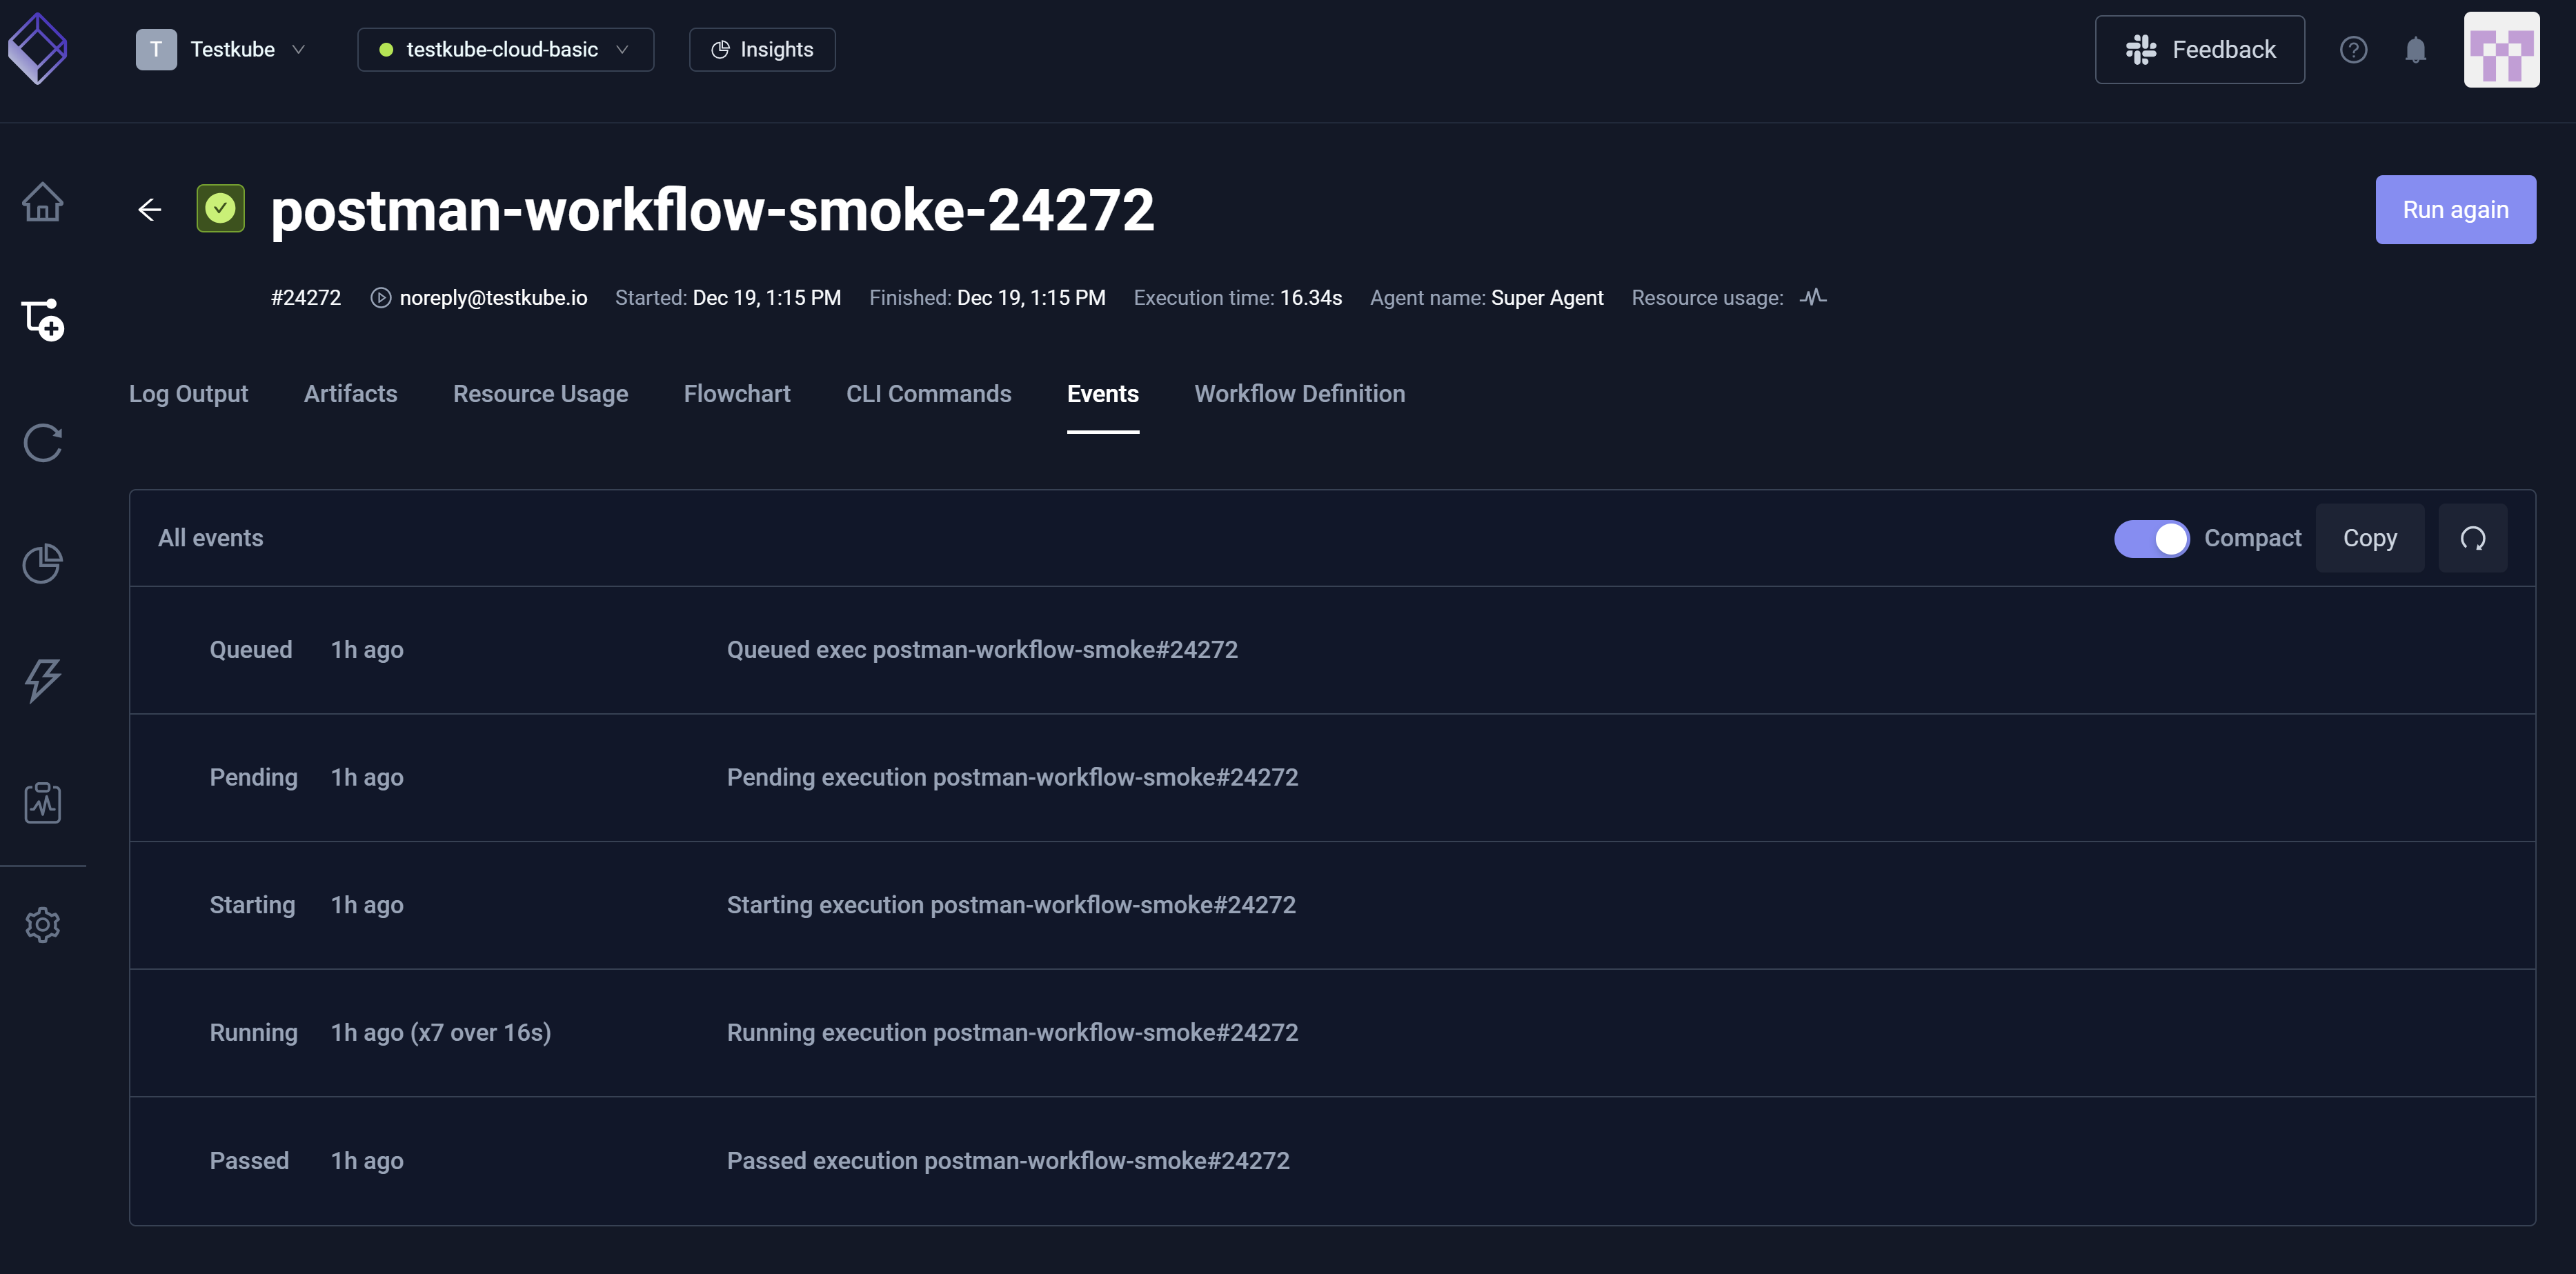
Events
This tab captures significant lifecycle actions (such as Start, Completion, and Failure) that occurred during execution runtime.
You must enable this feature under Organization Management/Product Features/Scheduler Events.
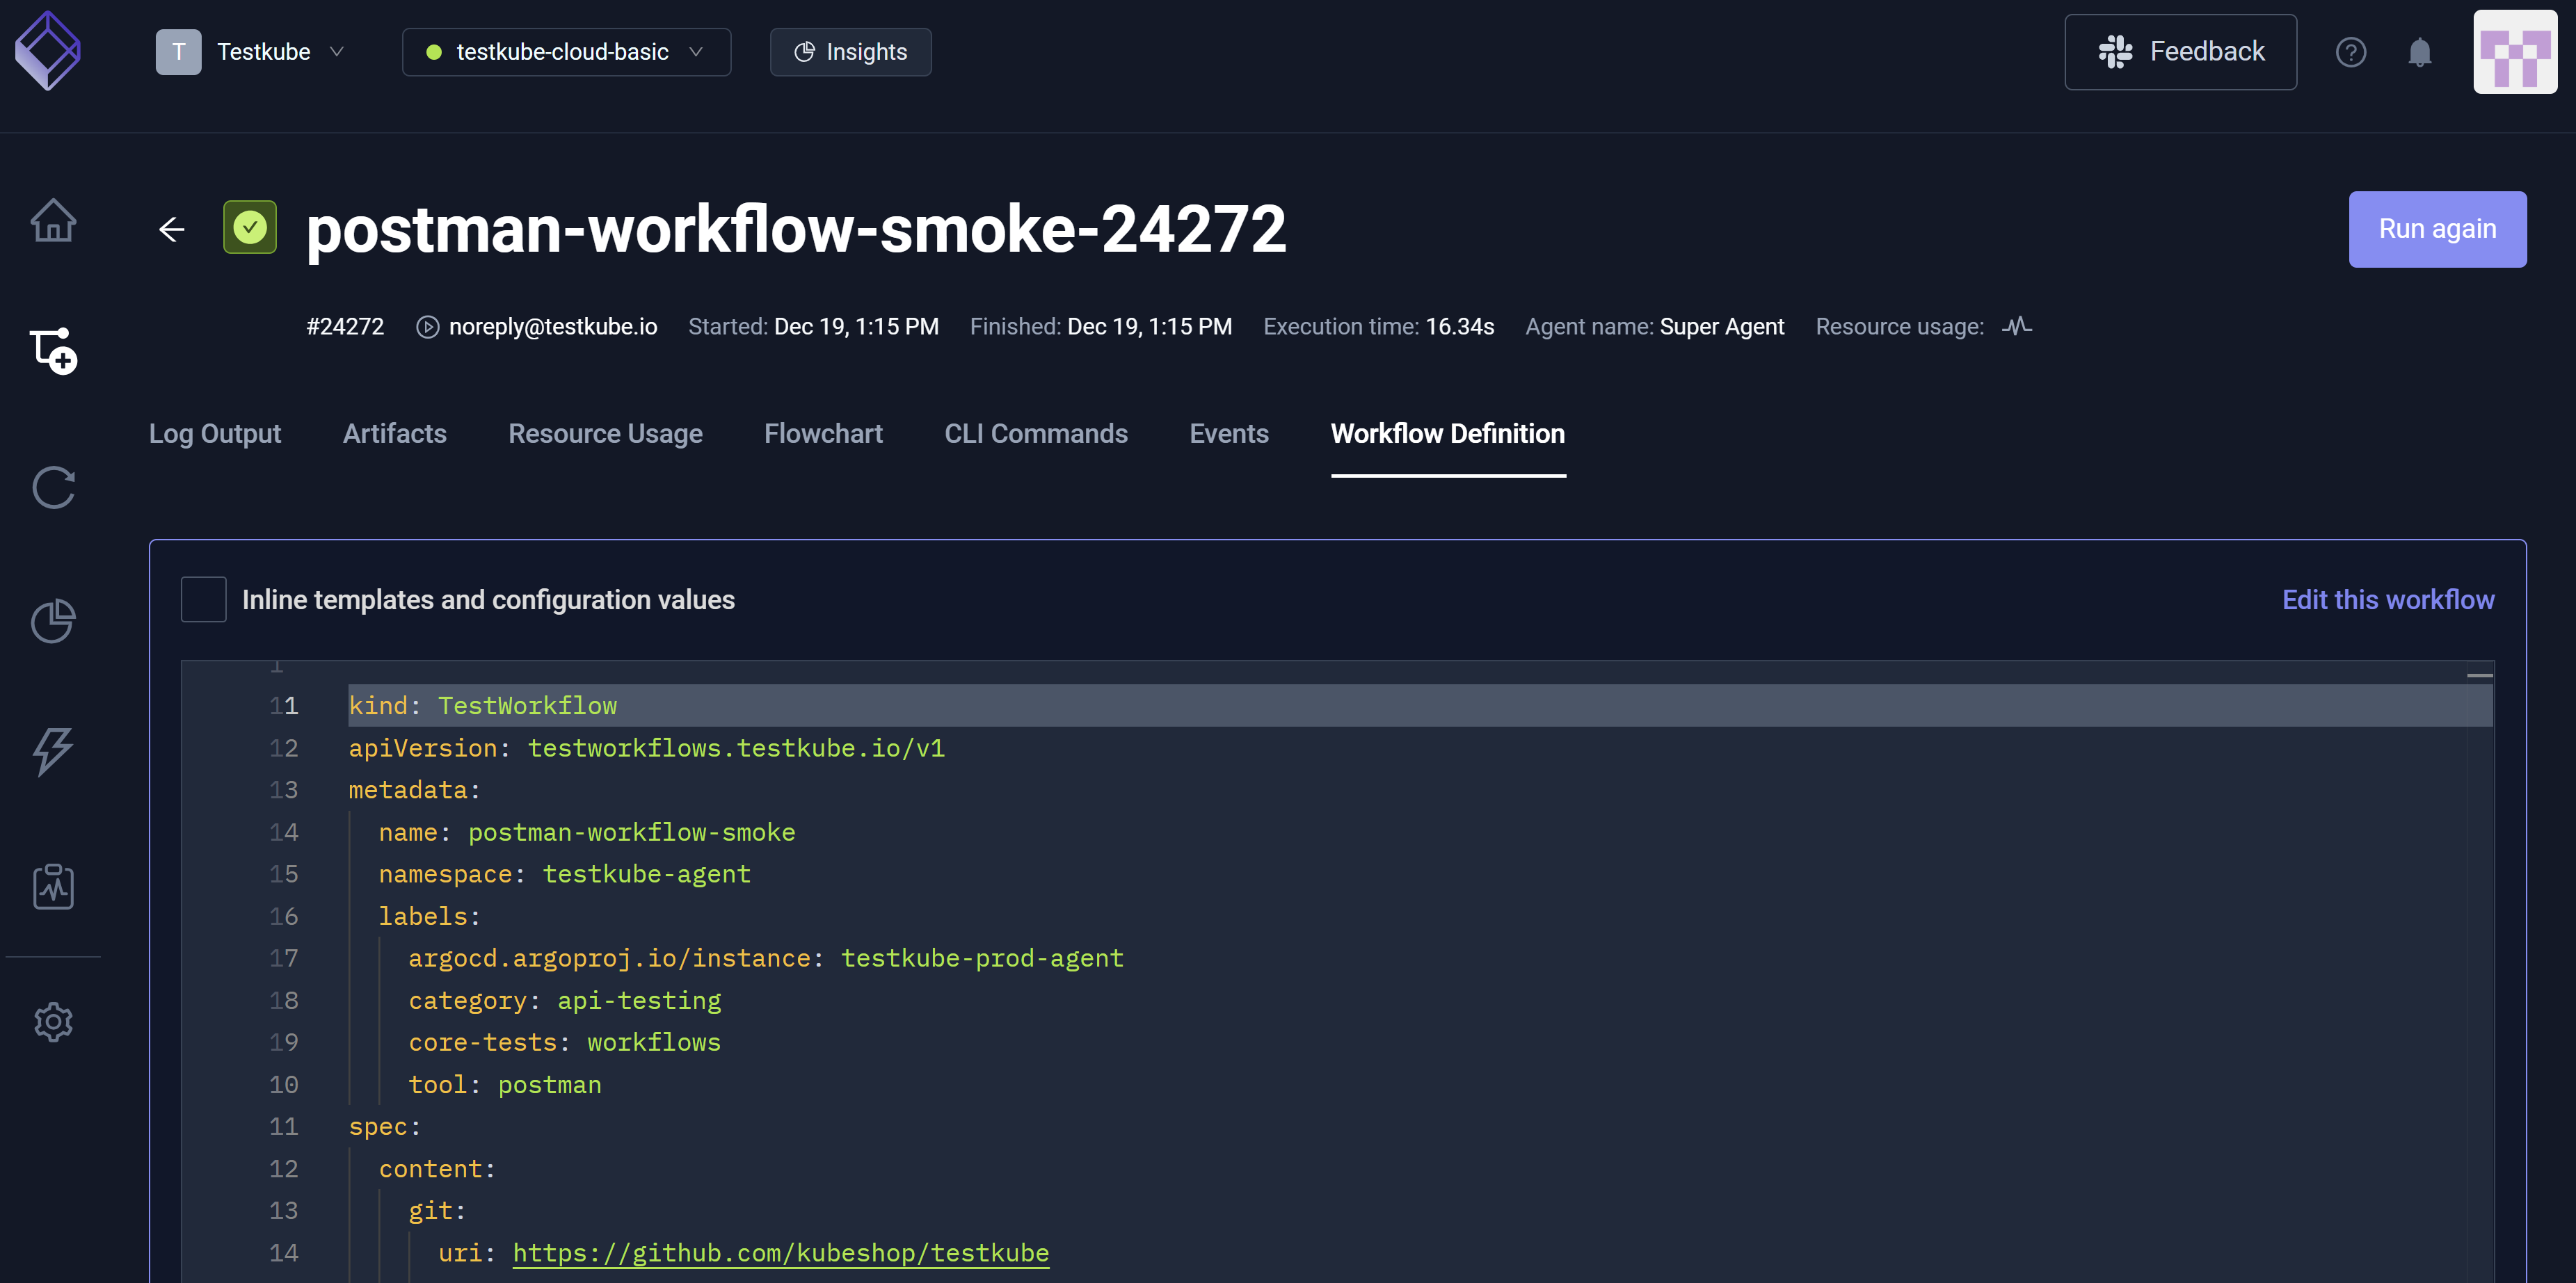
Workflow Definition
This tab displays the YAML that allows you to configure the Workflow.