Testkube Dashboard
The Testkube dashboard offers a centralized user interface for managing Testkube deployments. The dashboard is part of the
Testkube Control Plane and is available after installation via local port-forwarding using the
testkube dashboard command or through use of the NGINX Ingress Controller. For additional information,
read Production Installations.
Dashboard:
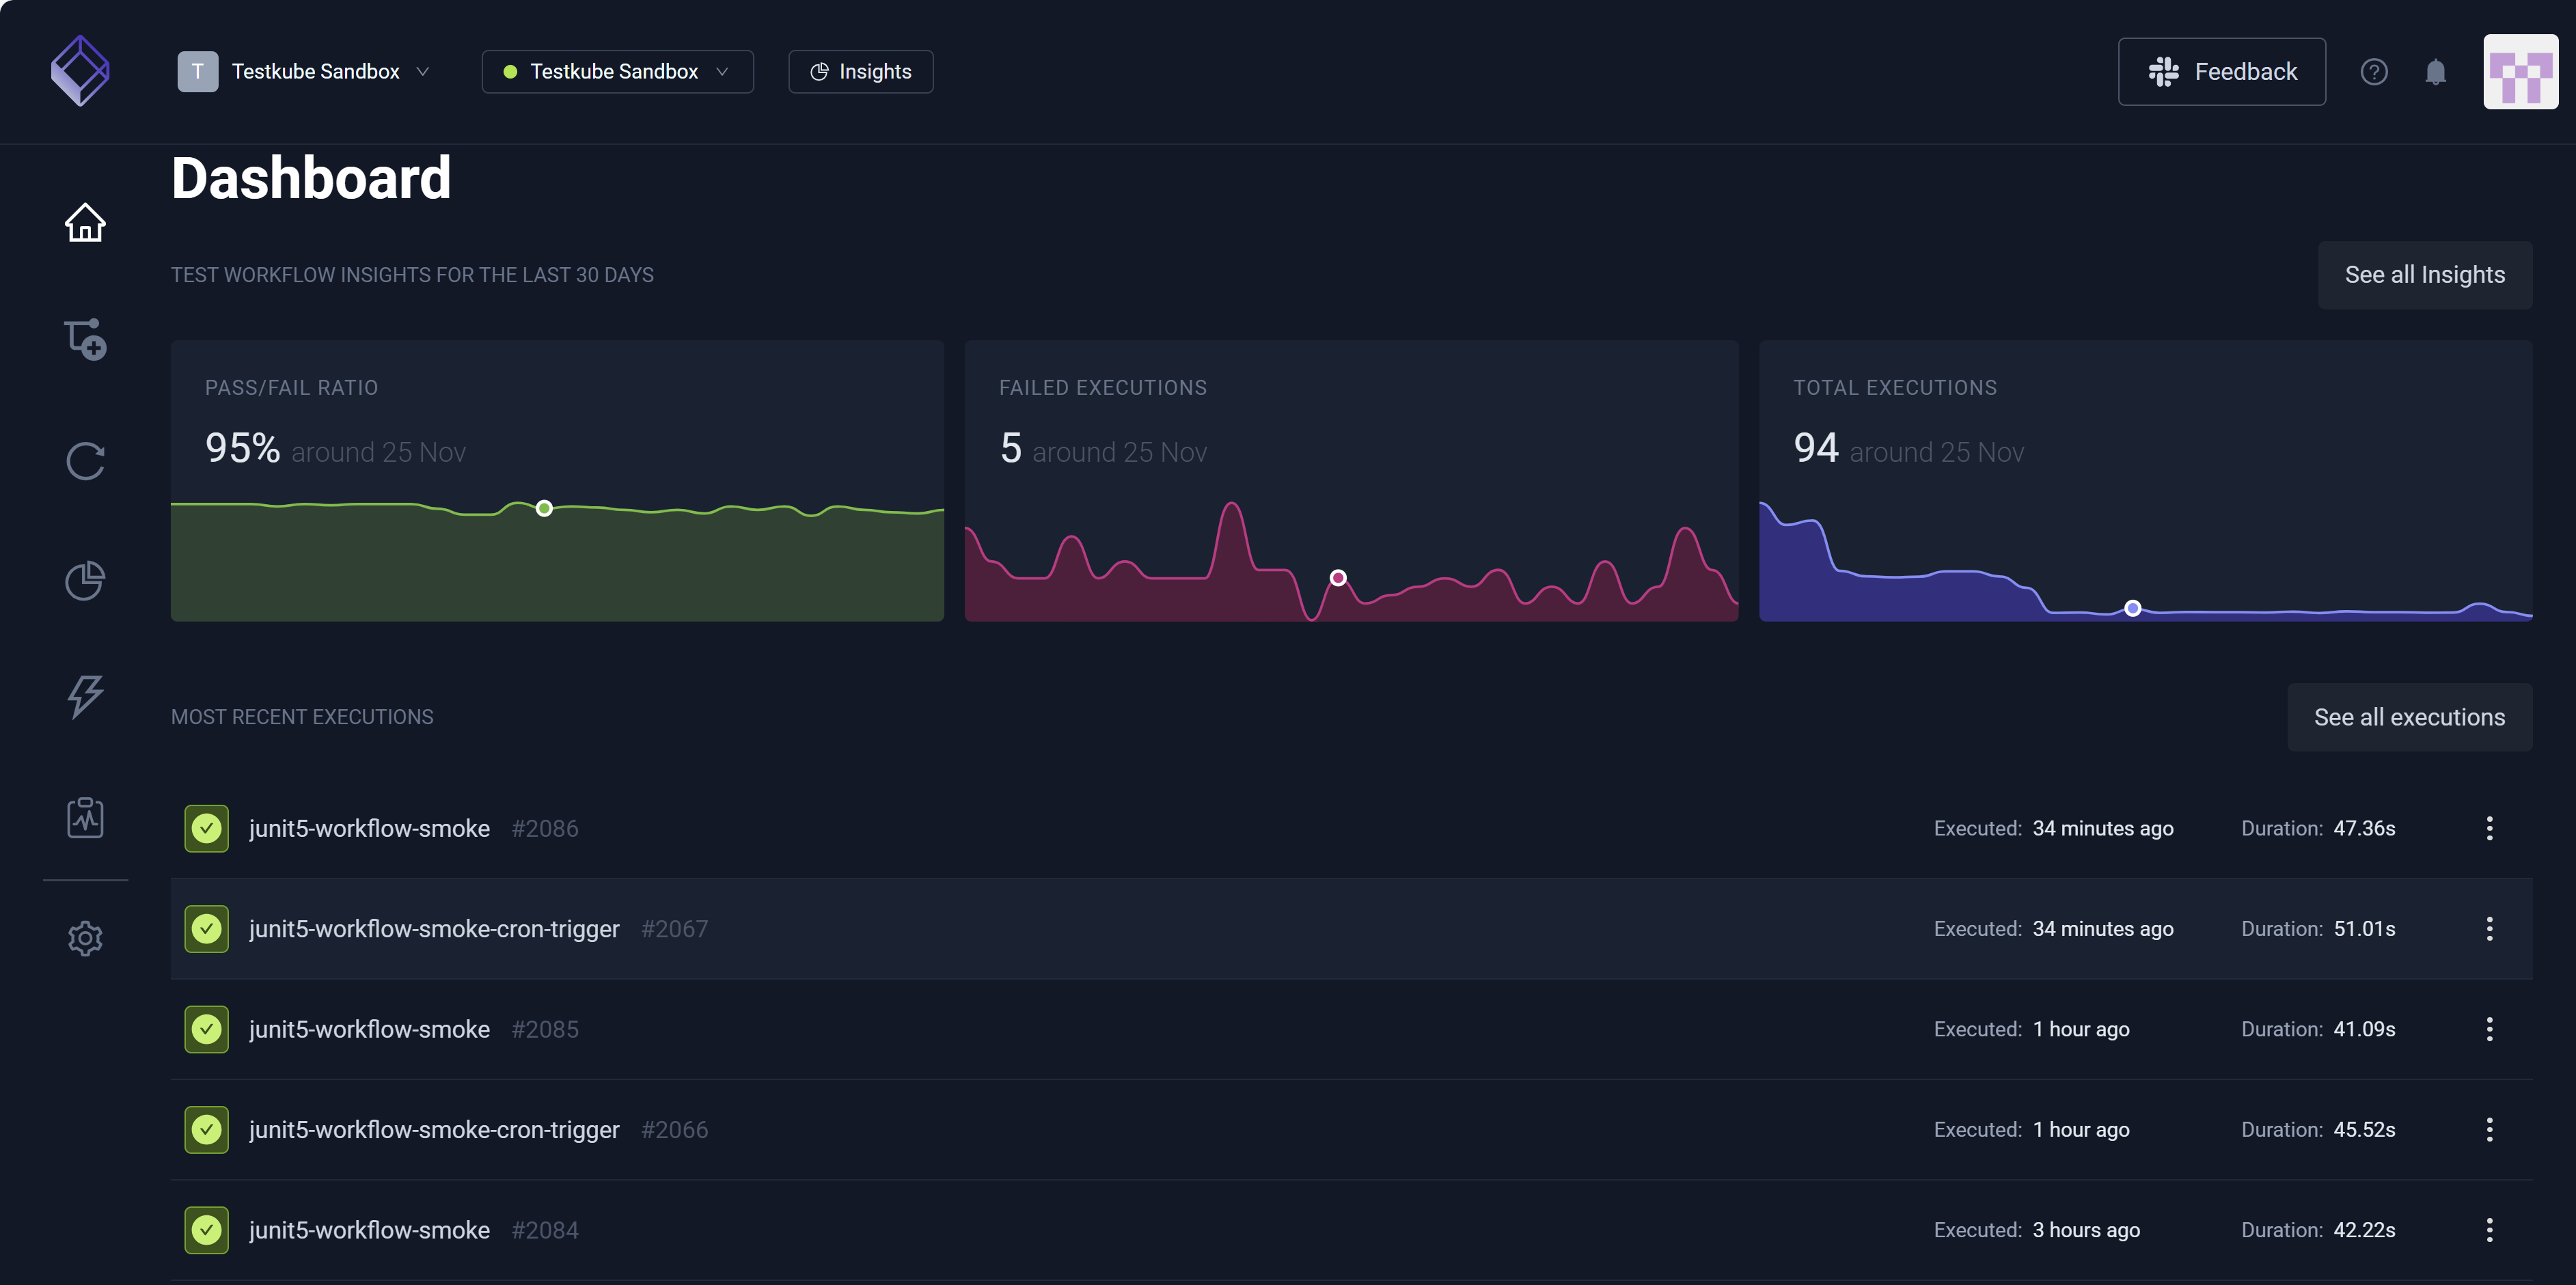
Testkube Sandbox appears in the Organization and Environment drop-down list boxes near the dashboard (top left) when you are in the Testkube Sandbox environment. When you are not in this environment, these fields display and list your company-related Organization and Environment, respectively. You can select the arrows associated with each to view a list of options, allowing you to change these selections. Insights and See all insights launch you to visual analytics specific to system performance and test results.
For additional information on how to manage your Testkube instance, read Organizations and Environments.
The left navigation pane contains:
Environment Overview
Workflow Insights (top middle) provides an overview of the Environment you selected and includes:
- Pass/Fail Ratio
- Failed Executions
- Total Executions
The dashboard (center) contains a scrollable list of your Recent Executions. Selecting an Execution provides access to its corresponding Execution Details.