Distributed JMeter Example
info
This Workflows functionality is not available when running the Testkube Agent in Standalone Mode - Read More
Testkube has built-in support for parallelising any testing tool - check out the Parallelization documentation for details and examples.
The below example shows how to distribute a JMeter test across a configurable number of nodes
- Read JMX configuration from Git repository (
spec.content.git) - Start 5 remote workers (
spec.services.slave.count)- Distribute them evenly across nodes (
spec.services.slave.use[0]-distribute/evenlytemplate is setting commonpod.topologySpreadConstraints) - Reserve 1/8 CPU and 128MB memory for each instance (
spec.services.slave.container.resources) - Wait until they will accept connection at port 1099 (
spec.services.slave.readinessProbe)
- Distribute them evenly across nodes (
- Run JMeter controller against all the remote workers (
spec.services.steps[0].run)- It uses
{{ services.slave.*.ip }}as an argument -services.slave.*.ipwill return list of IPs, and they will be joined by comma (,) to convert to text
- It uses
Distributed JMeter Workflow
kind: TestWorkflow
apiVersion: testworkflows.testkube.io/v1
metadata:
  name: distributed-jmeter-example-config-artifacts
  namespace: testkube
  labels:
    docs: example
spec:
  config:
    slavecount:
      type: integer
      default: 3
  content:
    git:
      uri: https://github.com/kubeshop/testkube
      revision: main
      paths:
      - test/jmeter/jmeter-executor-smoke.jmx
  container:
    workingDir: /data/repo/test/jmeter
  services:
    slave:
      use:
      - name: distribute/evenly
      count: config.slavecount
      logs: always
      timeout: 30s
      image: alpine/jmeter:5.6
      command:
      - jmeter-server
      - -Dserver.rmi.localport=60000
      - -Dserver_port=1099
      - -Jserver.rmi.ssl.disable=true
      readinessProbe:
        tcpSocket:
          port: 1099
        periodSeconds: 1
  steps:
  - name: Run tests
    run:
      image: alpine/jmeter:5.6
      shell: |
        mkdir -p /data/artifacts
        jmeter -n \
          -X -Jserver.rmi.ssl.disable=true -Jclient.rmi.localport=7000 \
          -R {{ services.slave.*.ip }} \
          -t jmeter-executor-smoke.jmx \
          -j /data/artifacts/jmeter.log \
          -o /data/artifacts/report \
          -l /data/artifacts/jtl-report.jtl -e
    artifacts:
      paths:
      - /data/artifacts/**/*
After execution, you can see the output from the test executions under the executions panel tabs:
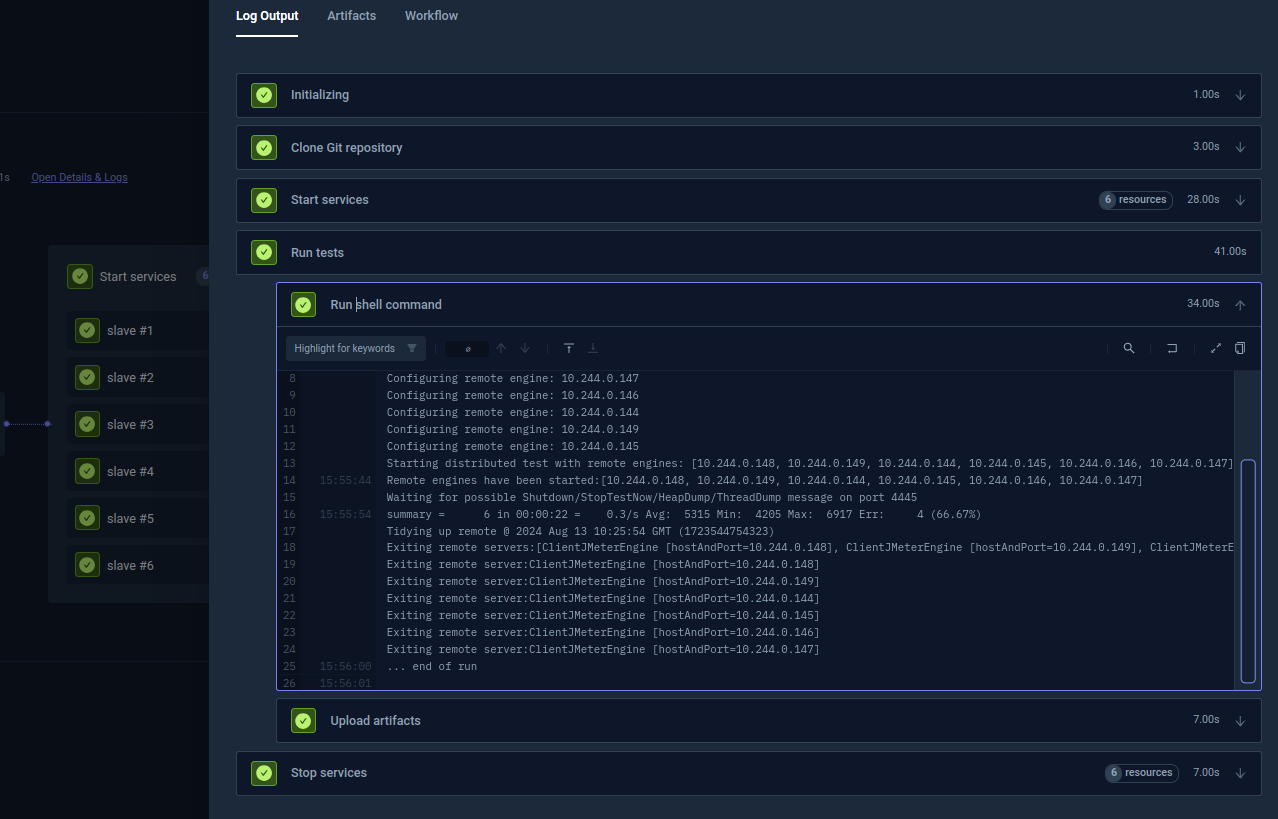
- Log Output
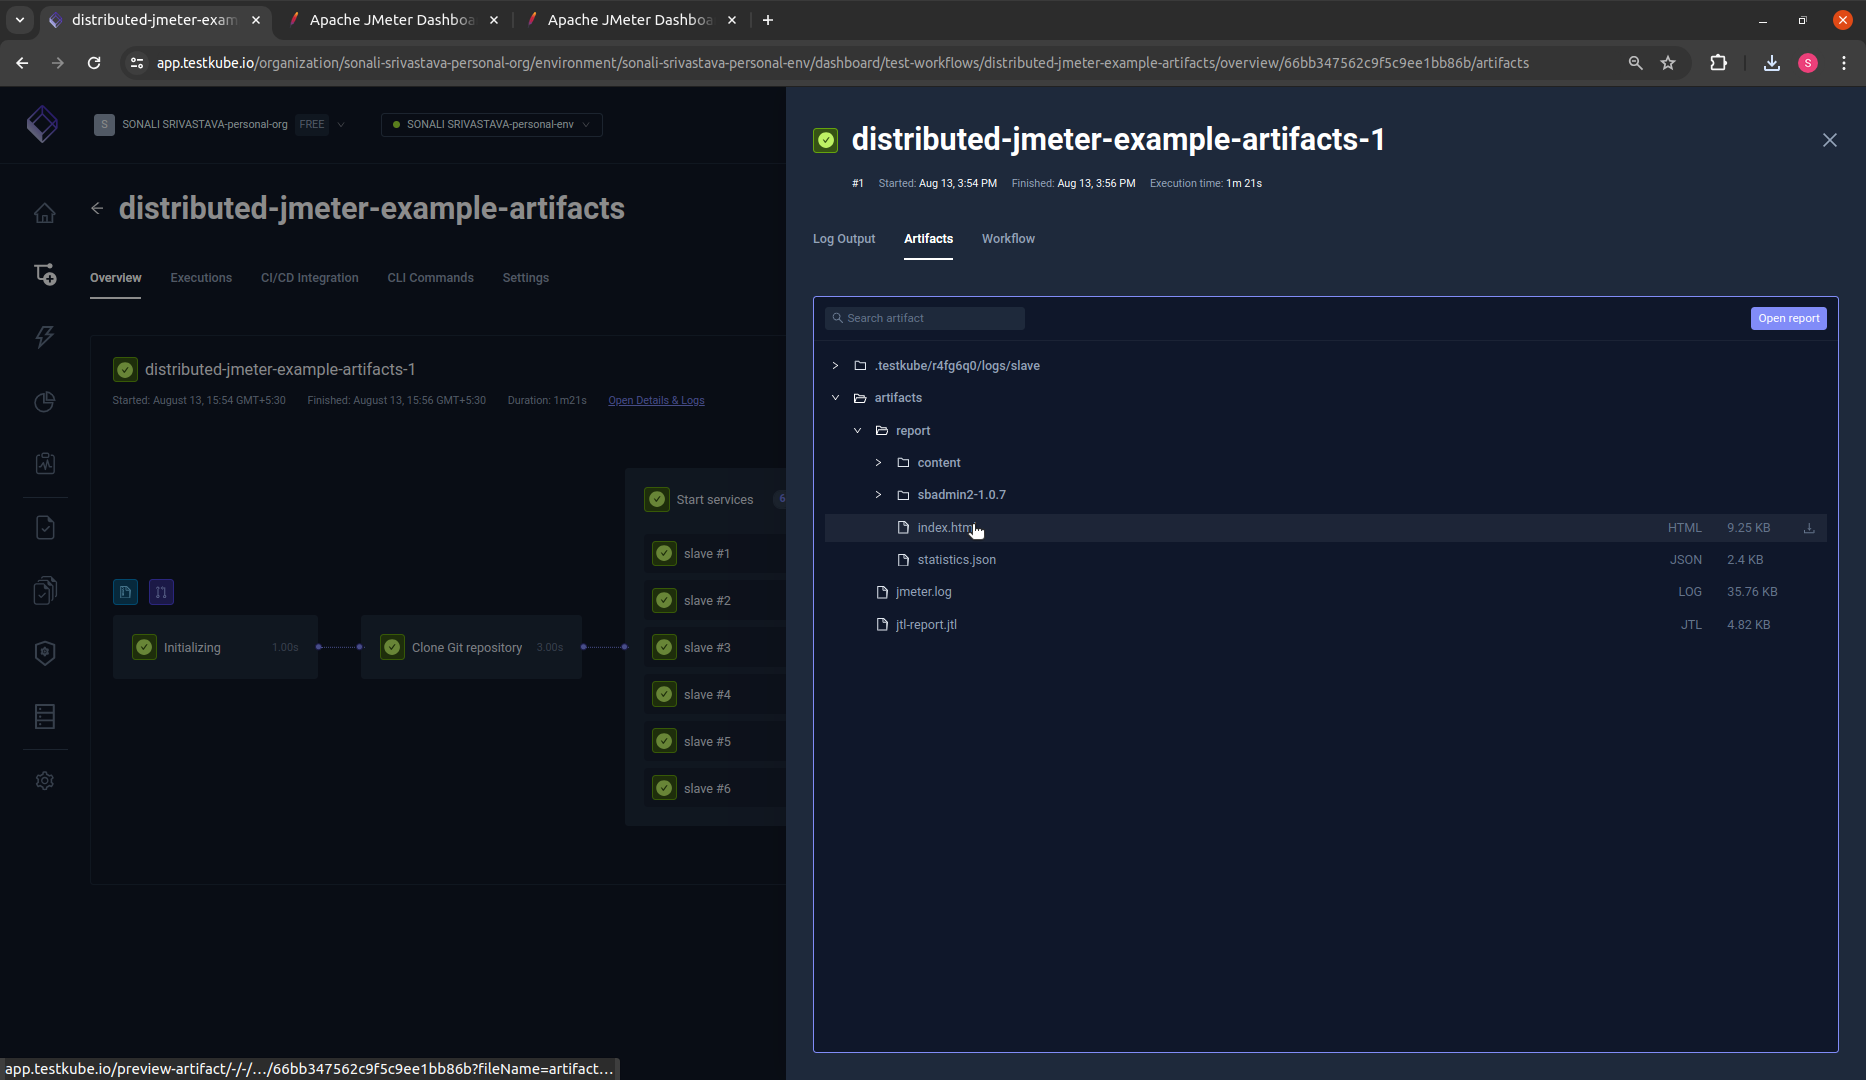
- Artifacts
- HTML Report
The log output from the JMeter execution:
The uploaded report is available in the Artifacts tab:
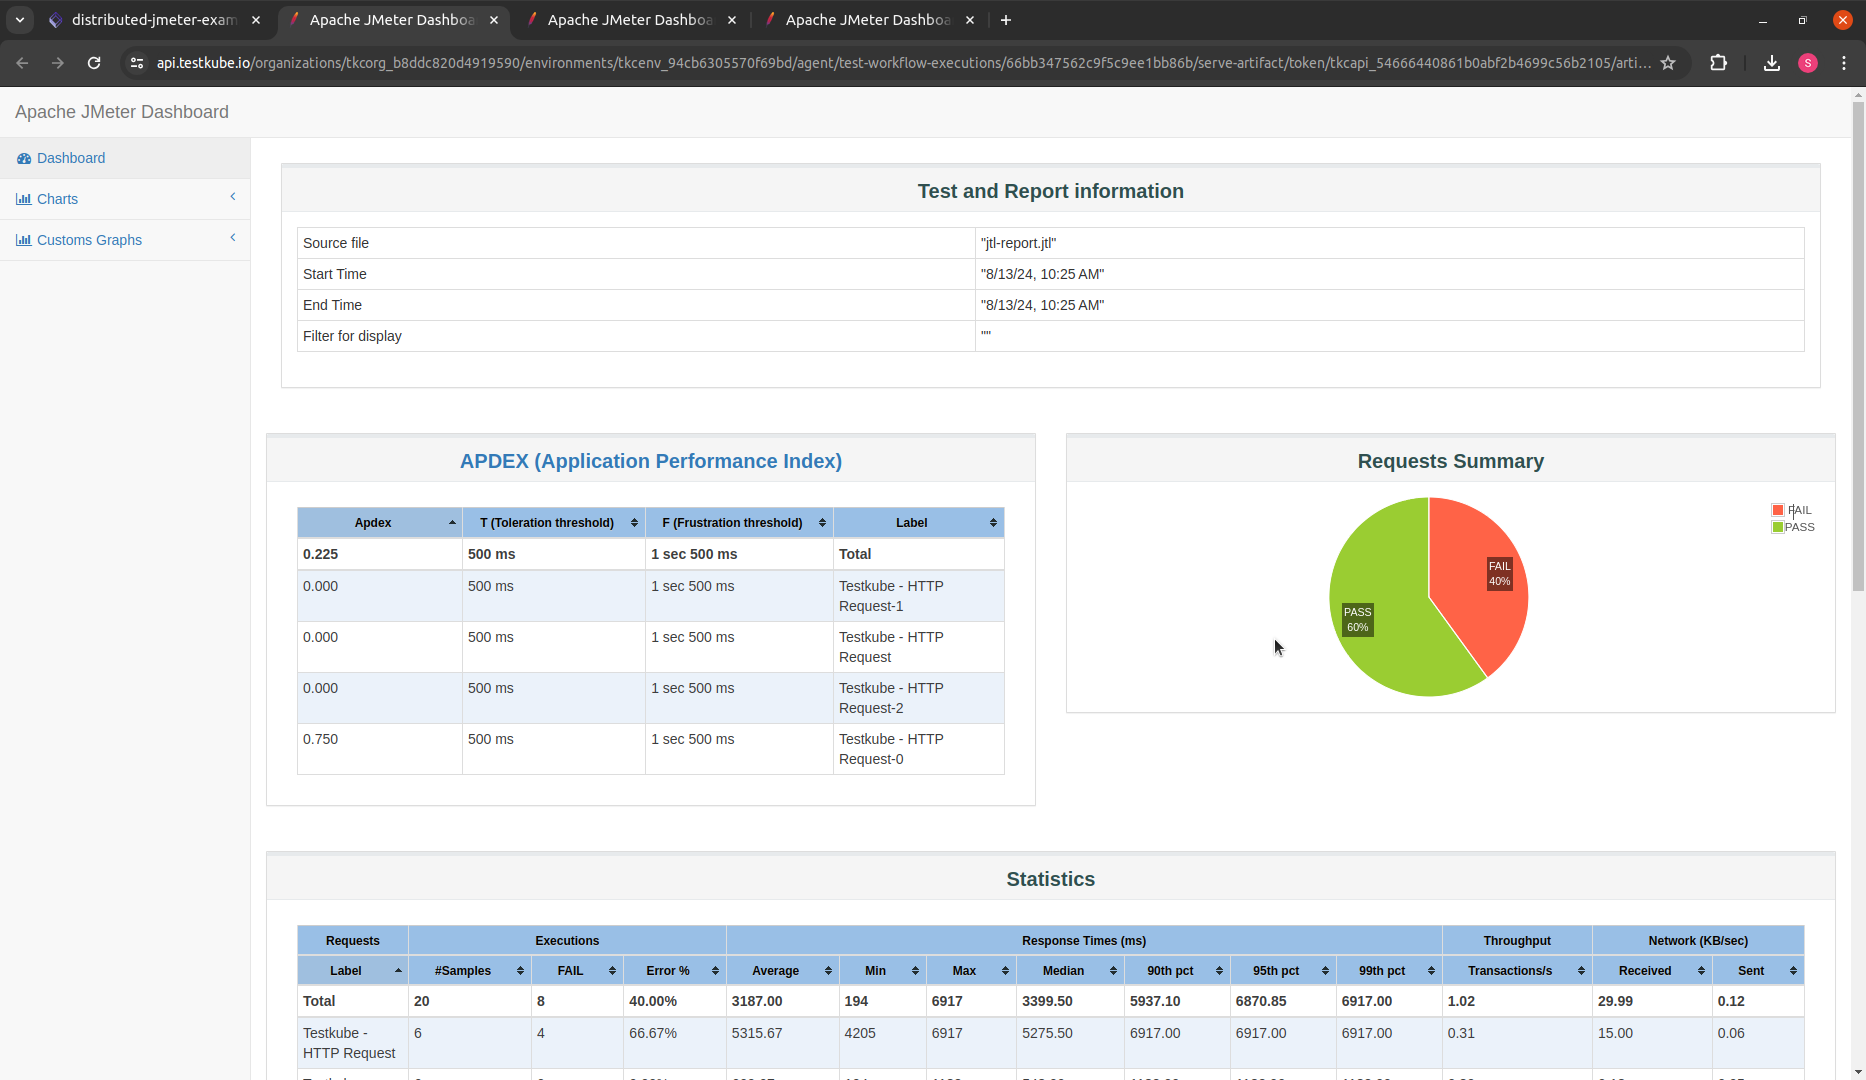
Clicking on Open Report in the artifacts or selecting index.html loads complete report live in your browser: